Solana (SOL) Price Has Declined, What Will Happen Next? (27/2/25)

Jakarta, Pintu News – Solana has experienced a sharp decline after failing to break resistance at $185. Now, the cryptocurrency is under pressure, with its value continuing to slide below several key support levels.
Solana Performance (SOL)
Solana (SOL) has experienced significant difficulties in recent times, especially after failing to break the $185 resistance barrier. This price drop came alongside dips below the $162 and $150 support levels, which marked the beginning of a deeper decline. Solana (SOL) even dipped below $135, registering a new low of $131. Currently, Solana (SOL) is trying to consolidate losses, but it is still bearish.
Also Read: Bybit Recovers $600 Million Ethereum (ETH) After $1.5 Billion Crypto Robbery
Technical Analysis: Solana (SOL) Price Movement
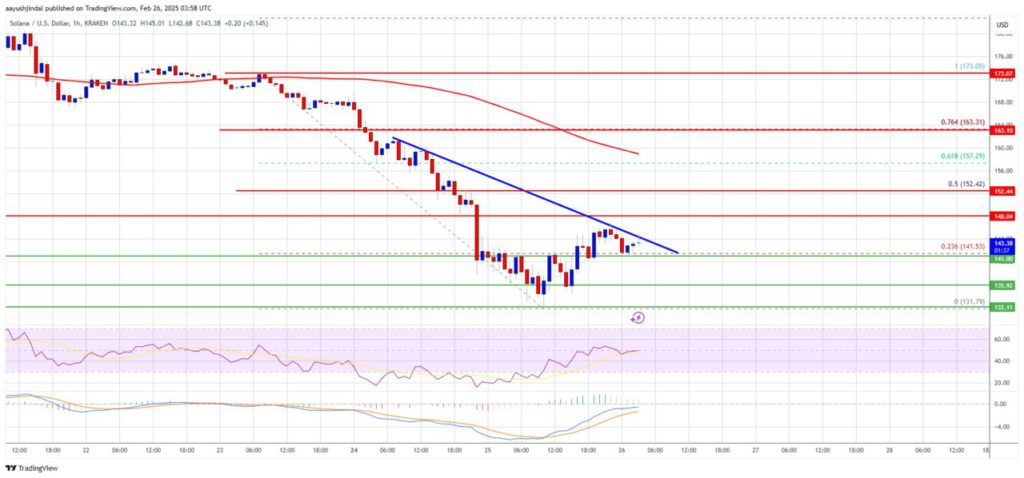
In technical analysis, Solana (SOL) is now trading below $145 and the 100-hourly simple moving average. There is resistance faced near the $144 level, where a bearish trend line is formed on the hourly chart of the SOL/USD pair.
The next major resistance is near $150, with key resistance at $152, which is also the 50% Fibonacci retracement level of the move down from $173 to $131. If Solana (SOL) manages to close above the $152 resistance zone, this could be the start of a steady rise. The next key resistance is $160, and further gains could push the price towards $165.
Solana (SOL) Price Drop Potential
If Solana (SOL) doesn’t manage to break through the $145 resistance, there is a chance that the currency will experience another decline. Initial support lies in the $141 zone, with the next major support near the $136 level.
If the price breaks below $136, it could push Solana (SOL) towards the $131 zone. A close below $125 support could trigger further declines towards $120 support in the near term.
Technical Indicators: Bearish Signal for Solana (SOL)
The hourly Moving Average Convergence Divergence (MACD) indicator for SOL/USD shows a decrease in momentum within the bearish zone. Meanwhile, the hourly Relative Strength Index (RSI) for SOL/USD is below the 50 level, signaling that sellers still have control over the market. This suggests that selling pressure is still quite strong and could affect Solana’s (SOL) price movement going forward.
Conclusion: The Future of Solana (SOL) Price
With the current bearish market conditions, Solana (SOL) investors and traders need to be aware of the potential for further declines. Monitoring support and resistance levels, as well as technical indicators, will be crucial in determining the next direction of the Solana (SOL) price.
Also Read: Uniswap Successful, SEC Case Terminated: Will UNI Surge? (2/27/25)
That’s the latest information about crypto news today. Get more information about crypto academy from beginner to expert level only at Pintu Academy and enrich your knowledge about the world of crypto and blockchain.
Follow us on Google News to get the latest information about crypto and blockchain technology. Enjoy an easy and secure crypto trading experience by downloading Pintu Crypto via Google Play Store or App Store now.
Experience web trading with advanced trading tools such as pro charting, various order types, and portfolio tracker only at Pintu Pro. Click Register Pintu if you don’t have an account or click Login Pintu if you are already registered.
*Disclaimer
This content aims to enrich readers’ information. Pintu collects this information from various relevant sources and is not influenced by outside parties. Note that an asset’s past performance does not determine its projected future performance. Trading crypto carries high risk and volatility, always do your own research and use cold hard cash before investing. All activities of buying andselling Bitcoin and other crypto asset investments are the responsibility of the reader.
Reference
- NewsBTC. Solana (SOL) Sees Red, But Analysts Expect a Rebound. Accessed on February 26, 2025
- Featured Image: CoinMarketCap