Bitcoin (BTC) Starts to Rise, Potential Resistance and Support in Early March 2025

Jakarta, Pintu News – The Bitcoin market has recently shown signs of recovery after experiencing a drop to the $82,000 zone. Now, Bitcoin (BTC) has broken back above $88,500 and has the potential to retest the $95,000 resistance zone.
Bitcoin (BTC) Price Recovery
After experiencing a sharp drop below the $92,000 level, Bitcoin (BTC) briefly traded below $90,000 and $88,000 support. The lowest point was recorded at $81,434 before the price started to show waves of recovery. Significant gains were made, with Bitcoin (BTC) managing to break back above the $85,000 and $88,000 resistance levels.
Crypto market participants witnessed a rally that took the price past the 50% Fibonacci retracement level of the decline from $95,000 to $81,434. There was also a break above the bearish trend line that served as resistance at $90,000 on the hourly chart of the BTC/USD pair. Currently, Bitcoin (BTC) is trading above $90,000 and the 100-hour simple moving average.
Also Read: The Burning of 20 Million SHIBs: Will Shiba Inu Prices Skyrocket? (7/3/25)
Potential Resistance and Support
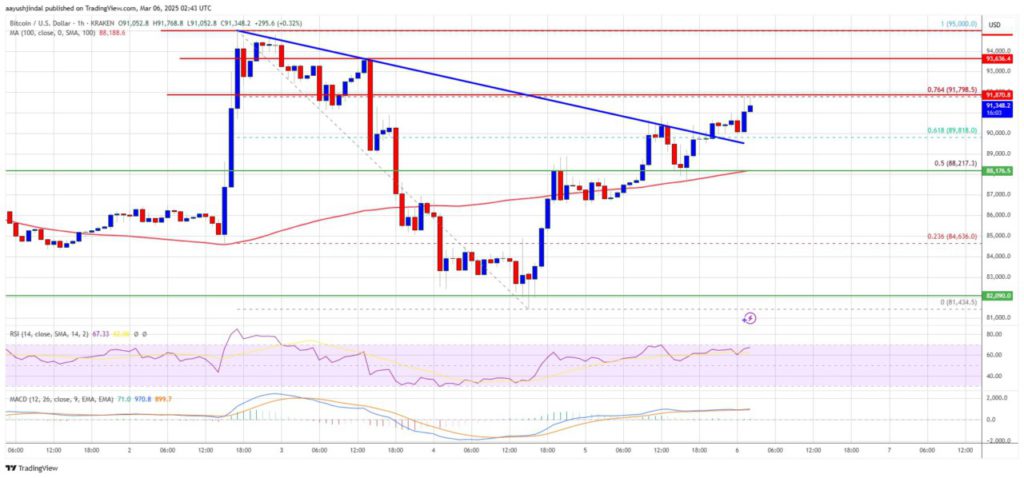
On the upside, immediate resistance is near the $91,800 level, which is the 76.4% Fibonacci retracement of the decline from $95,000 to $81,434. The first key resistance lies near $92,500, followed by $93,500. If the price manages to break above $93,500, this could push Bitcoin (BTC) higher towards $95,000. Further upside might lead the price towards $96,200 or even $98,000.
Possible Price Drop
If Bitcoin (BTC) fails to break through the $92,000 resistance zone, there is a possibility that the price will experience a new decline. Immediate support is near $88,000, with the next major support at $86,200. Further support lies in the $85,000 zone. A further drop could push the price back to the $82,000 support in the short term, with the key support being at $80,000.
Technical Indicators
The hourly MACD (Moving Average Convergence Divergence) indicator is now showing acceleration in the bullish zone. Meanwhile, the RSI (Relative Strength Index) for BTC/USD is now above the 50 level, suggesting that the current momentum may still favor a price increase.
Conclusion
With various technical indicators in favor, as well as an important breakout above a key resistance, Bitcoin (BTC) shows potential to resume the recovery rally. However, market participants should remain wary of potential downside if Bitcoin (BTC) fails to maintain momentum above critical resistance levels.
Also Read: Litecoin (LTC) Hit a Record High, Will the Price Surge? (7/3/25)
That’s the latest information about crypto news today. Get more information about crypto academy from beginner to expert level only at Pintu Academy and enrich your knowledge about the world of crypto and blockchain.
Follow us on Google News to get the latest information about crypto and blockchain technology. Enjoy an easy and secure crypto trading experience by downloading Pintu Crypto via Google Play Store or App Store now.
Experience web trading with advanced trading tools such as pro charting, various order types, and portfolio tracker only at Pintu Pro. Click Register Pintu if you don’t have an account or click Login Pintu if you are already registered.
*Disclaimer
This content aims to enrich readers’ information. Pintu collects this information from various relevant sources and is not influenced by outside parties. Note that an asset’s past performance does not determine its projected future performance. Trading crypto carries high risk and volatility, always do your own research and use cold hard cash before investing. All activities of buying andselling Bitcoin and other crypto asset investments are the responsibility of the reader.
Reference
- NewsBTC. Bitcoin Price Comeback to $90K Predicted by Analyst. Accessed on March 6, 2025
- Featured Image: Generated by AI