Onyxcoin (XCN) Experiences Correction After a 95% Rise: Momentum Weakens, What’s Next?

Jakarta, Pintu News – After recording a 95% price surge in the past week, Onyxcoin (XCN) is now starting to show signs of weakness. In the past 24 hours, the price of XCN has dropped by about 3%, raising the question of whether the recent rally is starting to lose steam. Several technical indicators such as RSI, BBTrend, and EMA lines are now giving signals that crypto investors and traders should pay attention to.
XCN’s RSI Drops: Early Sign of Correction?
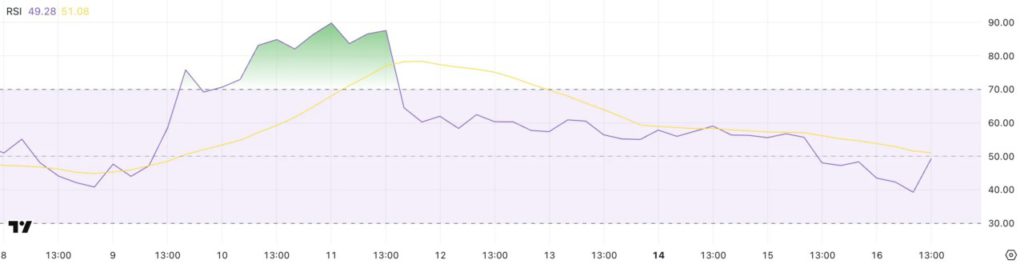
One technical indicator that is widely used to read momentum is the Relative Strength Index (RSI). Onyxcoin’s RSI is currently at 49.28, down from 56.74 in just the last two days. The RSI ranges from 0 to 100, with values above 70 indicating overbought conditions, while below 30 signals oversold. Values around 50 are considered neutral.
With the RSI dropping below 50, it signals that buying pressure is starting to weaken and selling pressure is slowly increasing. While not yet a strong sell signal, this RSI movement could be an early warning that the uptrend is starting to lose its strength. If the RSI continues to decline, then there is a possibility that the price of XCN will enter a correction phase in the short term.
Also Read: XRP Current State: Price Consolidation and Potential Breakout Amid Ripple and SEC Deal
BBTrend Shows Significant Weakening
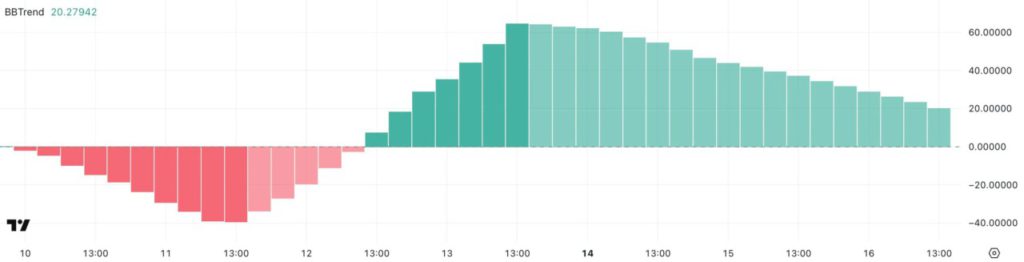
Another indicator that shows current market conditions is BBTrend (Bollinger Band Trend). This indicator measures the strength of the trend based on the width and expansion of the Bollinger Bands. In XCN’s case, BBTrend dropped sharply from 64 to 20.27 in the past three days.
This decline indicates a loss of previously strong momentum. This could cause prices to enter arange-bound phase or even a reversal if there are no positive catalysts to encourage renewed buying interest. With volatility starting to narrow, the XCN market could enter a long period of consolidation, unless there are external factors that trigger a surge in trading volume.
Potential for Further Decline: Beware of Support Points
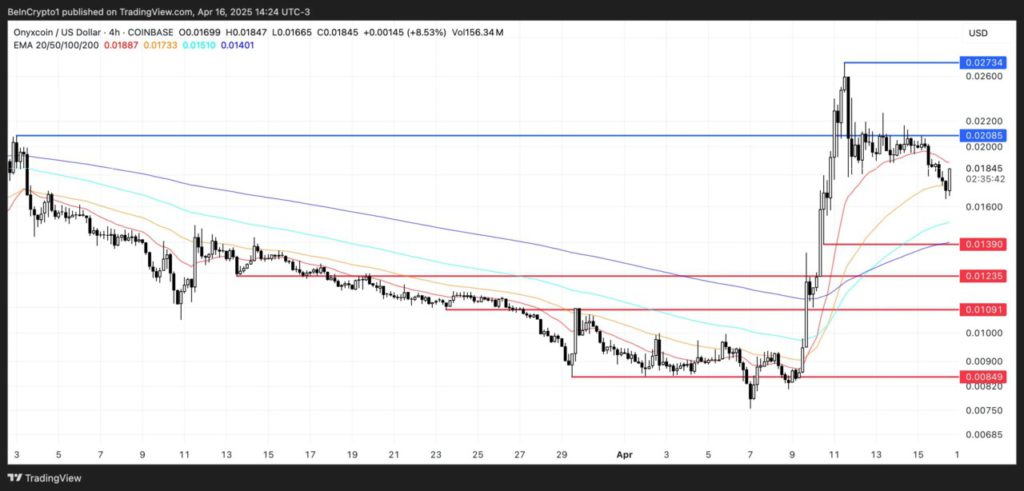
In terms of the Exponential Moving Average (EMA), the trend lines are starting to show signs of a death cross formation, which is when the short-term average crosses down below the long-term average. If this pattern is confirmed, it could strengthen the bearish signal and open up opportunities for a deeper correction.
The critical support level is currently at $0.0139 (approximately IDR233 at an exchange rate of IDR16,820/USD). If the price of XCN drops below this level, the next targets are $0.012 (IDR202), then $0.010 (IDR168), and even $0.00849 (IDR143) as the next lower limit. However, if buyers manage to hold support and push for a rebound, XCN could rally again and aim for resistance at $0.020 (IDR336), and further to $0.027 (IDR454).
Short-term Outlook: Correction or Opportunity?
With technical signals pointing to weakness, short-term traders are advised to exercise caution and strict risk management. But for long-term investors, the current condition could be a moment of evaluation to reassess their investment positions and strategies.
As always, the cryptocurrency market is heavily influenced by volatility, global news, and investor sentiment. Therefore, technical analysis needs to be combined with monitoring the fundamentals and ecosystem developments of related crypto projects, including Onyxcoin (XCN) itself.
Conclusion
Onyxcoin (XCN) is facing a consolidation phase after a sharp rally in the past week. While it is too early to conclude that the uptrend has ended, technical indicators suggest that the market is starting to lose momentum. With clear support and resistance points, traders and investors should be vigilant and prepared for both correction and recovery scenarios.
Also Read: XRP Price Outlook After Ripple and SEC Lawsuit Settlement
That’s the latest information about crypto news today. Get more information about crypto academy from beginner to expert level only at Pintu Academy and enrich your knowledge about the world of crypto and blockchain.
Follow us on Google News to get the latest information about crypto and blockchain technology. Enjoy an easy and secure crypto trading experience by downloading Pintu Crypto via Google Play Store or App Store now.
Experience web trading with advanced trading tools such as pro charting, various order types, and portfolio tracker only at Pintu Pro. Click Register Pintu if you don’t have an account or click Login Pintu if you are already registered.
*Disclaimer
This content aims to enrich readers’ information. Pintu collects this information from various relevant sources and is not influenced by outside parties. Note that an asset’s past performance does not determine its projected future performance. Trading crypto carries high risk and volatility, always do your own research and use cold hard cash before investing. All activities of buying andselling Bitcoin and other crypto asset investments are the responsibility of the reader.
Reference:
- BeInCrypto. Onyxcoin (XCN) Rally Slows as Traders Take Profits. Accessed April 17, 2025.
- Featured Image: Blockzeit