Ethereum Price Dips on April 28 — But Whale Holdings Stay Surprisingly Strong!

Jakarta, Pintu News – Ethereum is showing new signs of strength by recording a 14% gain in the past seven days. Despite the recent rally, Ethereum has been trading below the $1,900 level since April 2, emphasizing the importance of key resistance levels going forward.
Whether Ethereum is able to break out to higher levels or instead experience selling pressure again will largely depend on its movement around key support and resistance zones.
Before that, let’s take a look at Ethereum’s price movements today!
Ethereum Price Drops 1.93% in 24 Hours
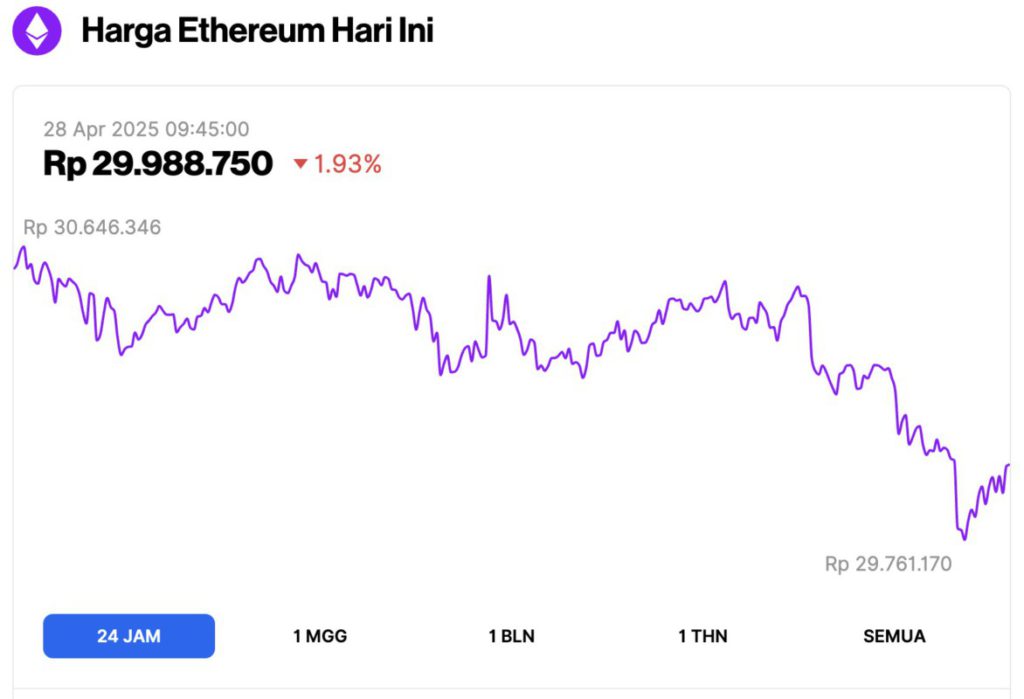
As of April 28, 2025, Ethereum (ETH) was trading at around $1,774, or approximately IDR 29,988,750, after slipping 1.93% over the past 24 hours. During this time, ETH reached a high of IDR 30,646,346 and dipped to a low of IDR 29,761,170.
At the time of writing, data from CoinMarketCap shows that Ethereum’s market capitalization stands at around $213.96 billion, with daily trading volume falling 12% to $11.26 billion in the last 24 hours.
Read also: Bitcoin Price Hovering at $93,000 Level Today (4/28/25): ARK Invest Forecasts BTC to Rise 2,400%!
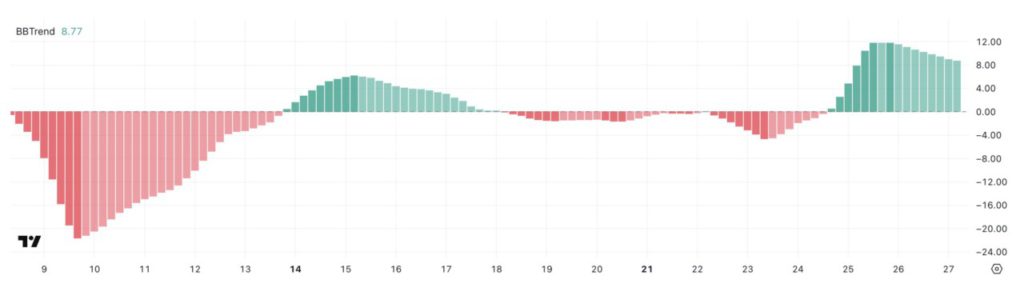
Ethereum BB Trend Starts to Cool Down: What Happens Next?
Currently, Ethereum’s BBTrend stands at 8.77, a noticeable drop from 11.83 two days ago.
Despite the decline, the indicator has remained in the positive zone for the past three days, signaling that Ethereum’s bullish structure is still holding up even though its momentum is starting to weaken.
This change could signal the beginning of a consolidation phase, which is a period where the market takes a pause before determining the direction of the next big move.
BBTrend, or Bollinger Band Trend, is a technical indicator that measures the strength of a trend by analyzing price behavior against Bollinger Bands.
When BBTrend values are high and positive, it usually indicates a strong uptrend; while negative values indicate a downtrend. With Ethereum’s BBTrend currently at 8.77, it means that the uptrend is still there, but its strength is starting to wane.
If buyers fail to take back control, the market could experience increased volatility, potential price corrections, or sideways movement.
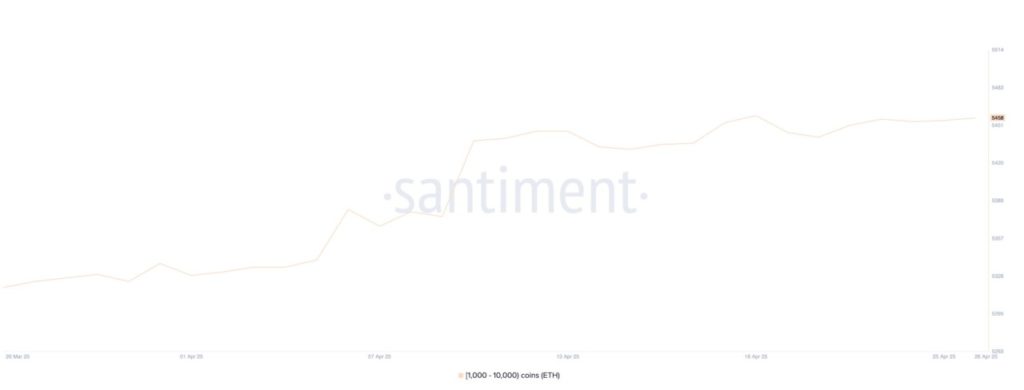
Ethereum Whale Holdings Stabilize
The number of Ethereum whales – i.e. wallets holding between 1,000 and 10,000 ETH – currently stands at 5,458.
This figure increased slightly from 5,442 on April 21 to 5,457 on April 23, and has stabilized in that range for the past four days.
This stabilization suggests a pause in accumulation or distribution activity from large holders, which could be a sign that the market is waiting for a catalyst before making the next big move.
Monitoring the movements of Ethereum whales is very important, as these large holders can have a major influence on price movements. When the number of whales increases, it often indicates confidence and potential accumulation, which usually has a positive impact on the price.
Also read: Lace Wallet Cardano (ADA) Partners with XRP, Ready to Drive Spectacular Price Spike!
Conversely, a decrease in the number of whales may indicate future selling pressure.
With the whale count currently standing at around 5,458, this could indicate a neutral stance from the big players – neither aggressively buying nor selling – which could potentially see market volatility decrease and prices move within a range until a clearer trend emerges.
Ethereum Battles Around $1,828: Break or Fall?
Ethereum’s EMA (Exponential Moving Average) line is currently showing a bullish formation, where the short-term EMA is above the long-term EMA – a classic signal of upward momentum.
Reporting from BeInCrypto (4/27/25), in recent days, ETH has tried to break the resistance zone around $1,828, but has not succeeded.
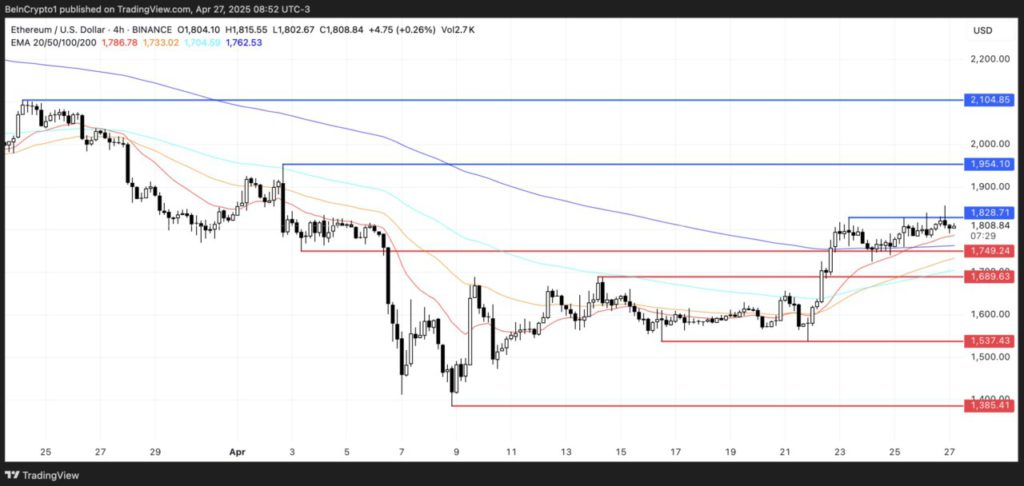
If Ethereum tests this level again and successfully breaks it, the next upside target is resistance at $1,954, with a potential further move towards $2,104.
Breaking the $2,000 level would be a significant achievement, as it would be the first time ETH has traded above that psychological level since March 27.
However, if the bullish momentum weakens and the trend reverses, Ethereum price could drop back to test support at $1,749. If this level fails to hold, ETH risks falling further to around $1,689.
If the selling pressure intensifies, the deeper support at $1,537 and even up to $1,385 could also be tested by the market.
That’s the latest information about crypto news today. Get more information about crypto academy from beginner to expert level only at Pintu Academy and enrich your knowledge about the world of crypto and blockchain.
Follow us on Google News to get the latest information about crypto and blockchain technology. Enjoy an easy and secure crypto retail and futures trading experience by downloading Pintu Crypto via Google Play Store or App Store now.
Experience web trading with advanced trading tools such as pro charting, various order types, and portfolio tracker only at Pintu Pro. Click Register Pintu if you don’t have an account or click Login Pintu if you are already registered.
*Disclaimer
This content aims to enrich readers’ information. Pintu collects this information from various relevant sources and is not influenced by outside parties. Note that an asset’s past performance does not determine its projected future performance. Crypto trading activities have high risk and volatility, always do your own research and use cold cash before investing. All activities of buying and selling bitcoin and other crypto asset investments are the responsibility of the reader.
Reference:
- BeInCrypto. Ethereum (ETH) Whale Stability Signals Calm Before Potential Major Move. Accessed on April 28, 2025