Price of 1 Pi Network (PI) in Indonesia Today (5/2/25)

Jakarta, Pintu News – The latest price of the Pi Network (PI) coin in Indonesia today, May 2, 2025, shows movement that has caught the attention of crypto investors. After experiencing a significant drop during April, PI is now starting to show signs of recovery. Is this momentum strong enough to push the price back to previous levels?
How much is 1 PI in Indonesia today?
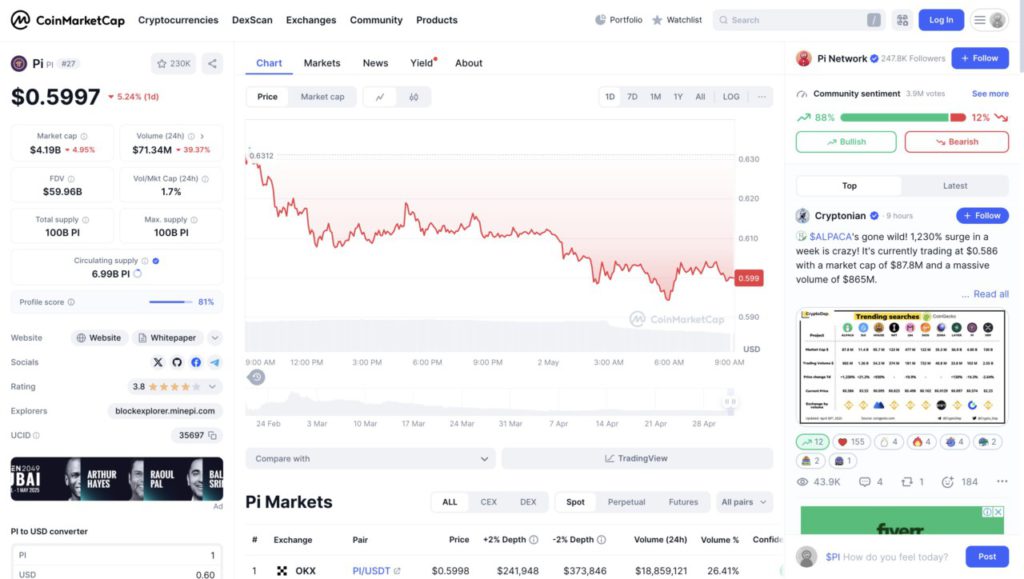
The price of Pi (PI) coin is currently $0.5997, representing a 5.24% decrease over the last 24 hours. The 1-day price chart shows a consistent downward trend since its peak around $0.6312.
The price movement tended to decrease gradually throughout the day, with some mild resistance points in the middle of the day. Still, it continued to weaken until it approached the daily low value around $0.599.
Fundamental data shows Pi’s market capitalization reached $4.19 billion (down 4.95%), with a daily trading volume of $71.34 million, which saw a sharp decline of 39.37%. The total supply and maximum supply are equal at 100 billion Pi, with the current circulating amount at 6.99 billion Pi.
Despite the price pressure, community sentiment towards Pi is still very positive, with 88% of the 3.9 million votes expressing a bullish stance, while only 12% are bearish.
Also read: Top 5 Cryptos Ready to Lead the Rally in May 2025
Pi Network (PI) Price Drops 18% During April – Bullish Signal Showing Rebound Potential?
Since reaching a high of nearly $3 in February, the price of the Pi (PI) coin has been in a steady decline, despite some brief rebounds. By the end of April, the PI price had fallen 18%, from $0.73 to $0.58, after repeatedly failing to break critical resistance levels.
However, as May approached, signs emerged that PI prices could recover. Here’s why:
PI Performance Expected to Change
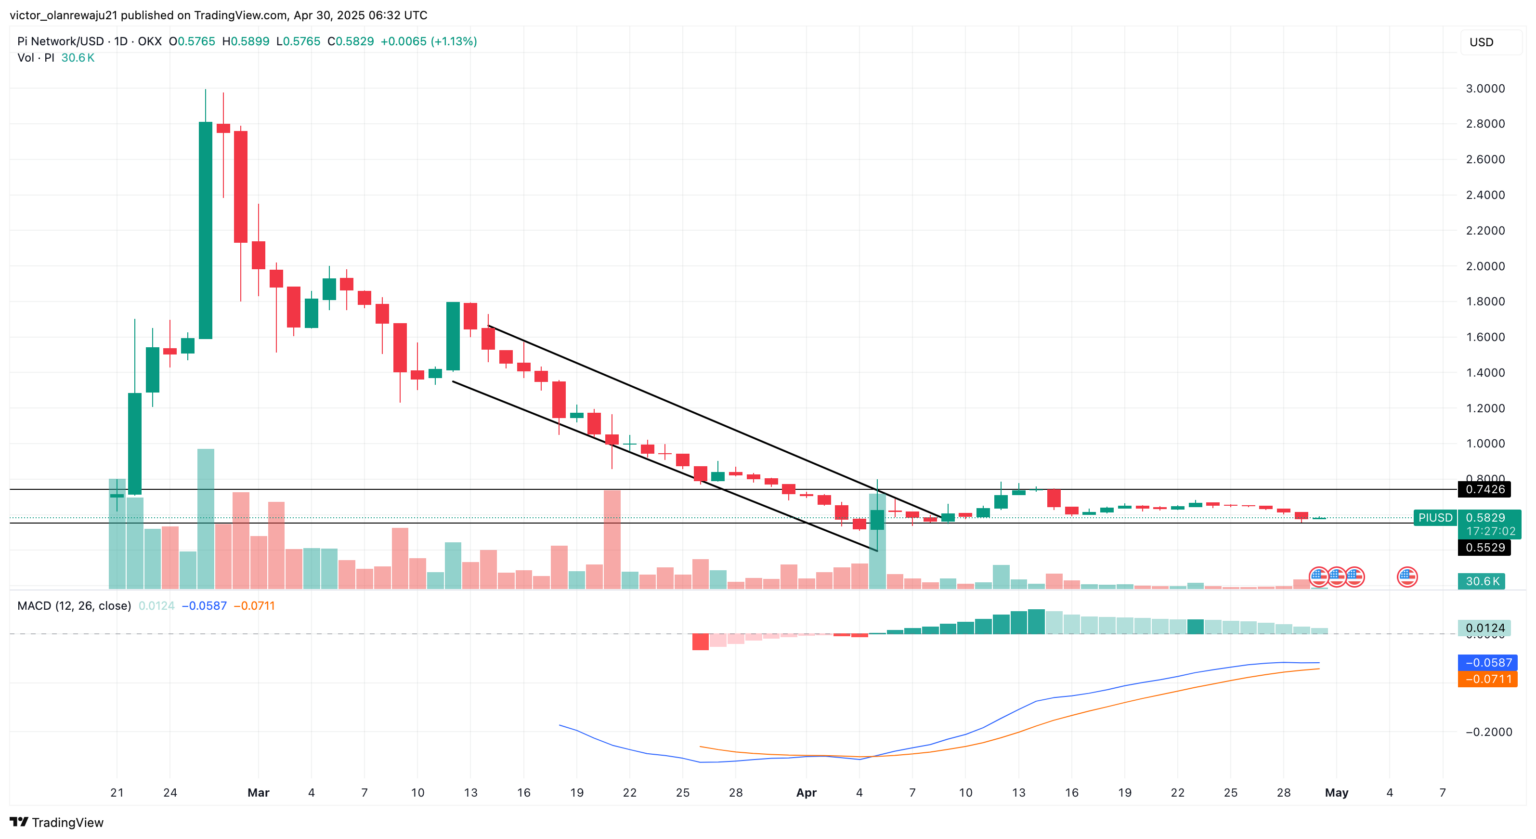
Between March 14 and early April, the price of PI moved in a descending channel pattern, resulting in a sharp decline from $1.69 to $0.57. However, in late April, the price started to consolidate, fluctuating between $0.55 and $0.73. Although the price tried to rise, the market remained sluggish, and there was no sign of a breakout.
Signs of Recovery Begin to Show
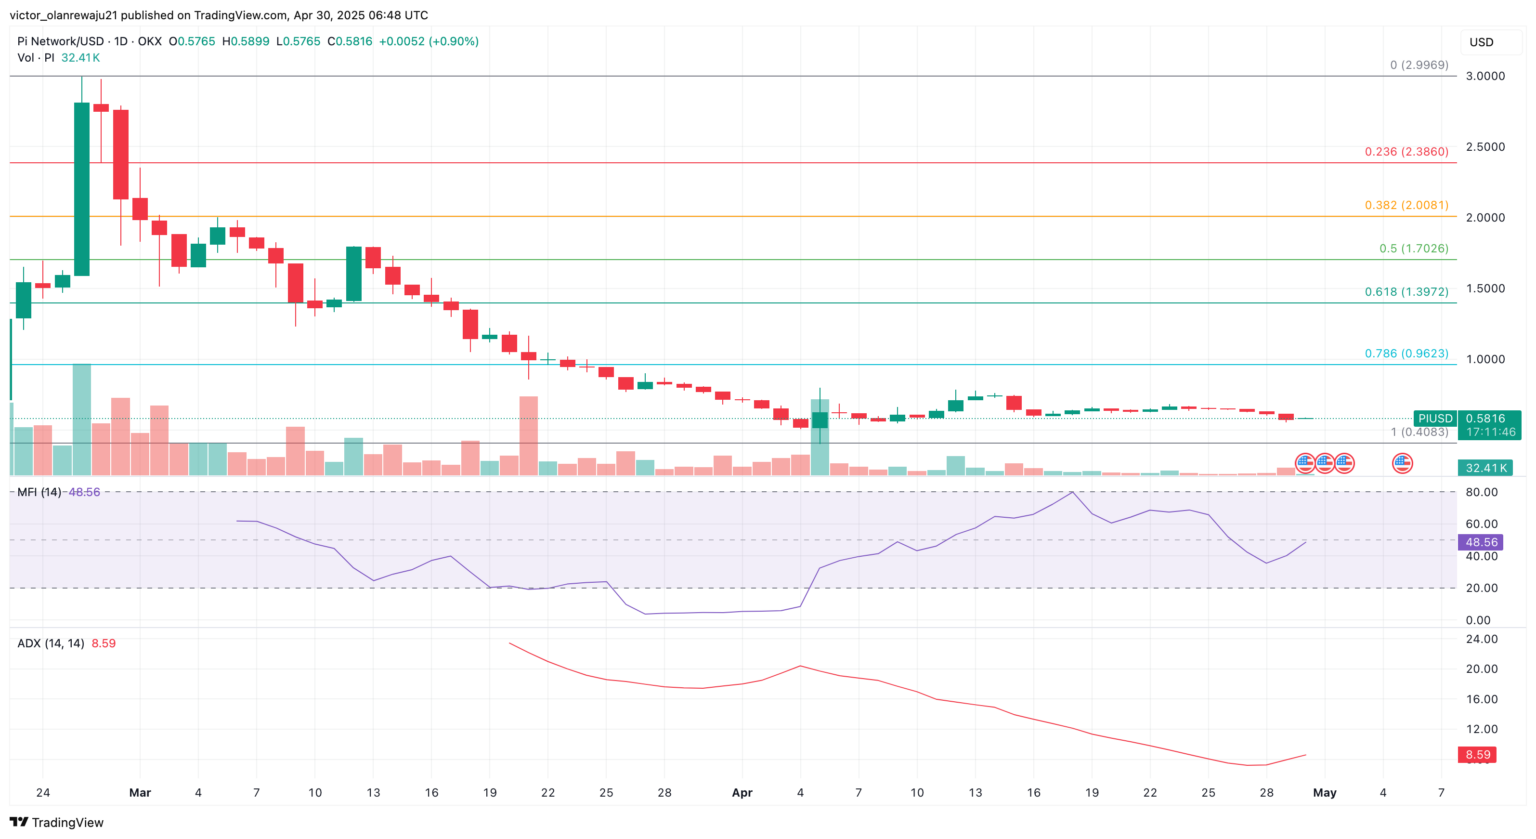
One technical indicator that shows changes is the MACD (Moving Average Convergence Divergence). This indicator measures the strength of a market trend based on two exponential moving average (EMA) lines. When the shorter EMA crosses above the longer EMA, it’s called a bullish signal, a sign of potential price increases.
Currently, on the daily chart, MACD is showing a positive signal, and the 12 EMA line has crossed the 26 EMA upwards, signaling a potential bullish divergence. If this trend continues, PI prices could soon start to erase April’s losses within the first few days of May.
That’s the latest information about crypto. Follow us on Google News to stay up-to-date on the world of crypto and blockchain technology.
Enjoy an easy and secure crypto trading experience by downloading Pintu crypto app via Google Play Store or App Store now. Get a web trading experience with advanced trading tools such as pro charting, various types of order types, and portfolio tracker only at Pintu Pro. Pintu Pro Futures is also available, where you can buy bitcoin leverage, trade btc futures, eth futures and sol futures easily from your desktop!
*Disclaimer
This content aims to enrich readers’ information. Pintu collects this information from various relevant sources and is not influenced by outside parties. Note that an asset’s past performance does not determine its projected future performance. Crypto trading activities have high risk and volatility, always do your own research and use cold cash before investing. All activities of buying and selling bitcoin and other crypto asset investments are the responsibility of the reader.
Reference:
- Featured Image: Coinpedia