Ethereum Holds Steady at $1,800 — Are Whales Fueling a Run Toward $2,000?

Jakarta, Pintu News – As Bitcoin struggles to break through the $94,000 level, Ethereum is still moving flat above the $1,750 level. However, the short-term decline in the overall market has triggered a quick correction to the lower limit.
Currently (6/5/25), Ethereum is trading at $1,801, reflecting a slight gain of 0.94% in the last 24 hours. Amidst market volatility, Ethereum is still holding its own-is there a chance for a rebound towards the $2,000 level in the near future?
Ethereum Price Up 0.94% in 24 Hours
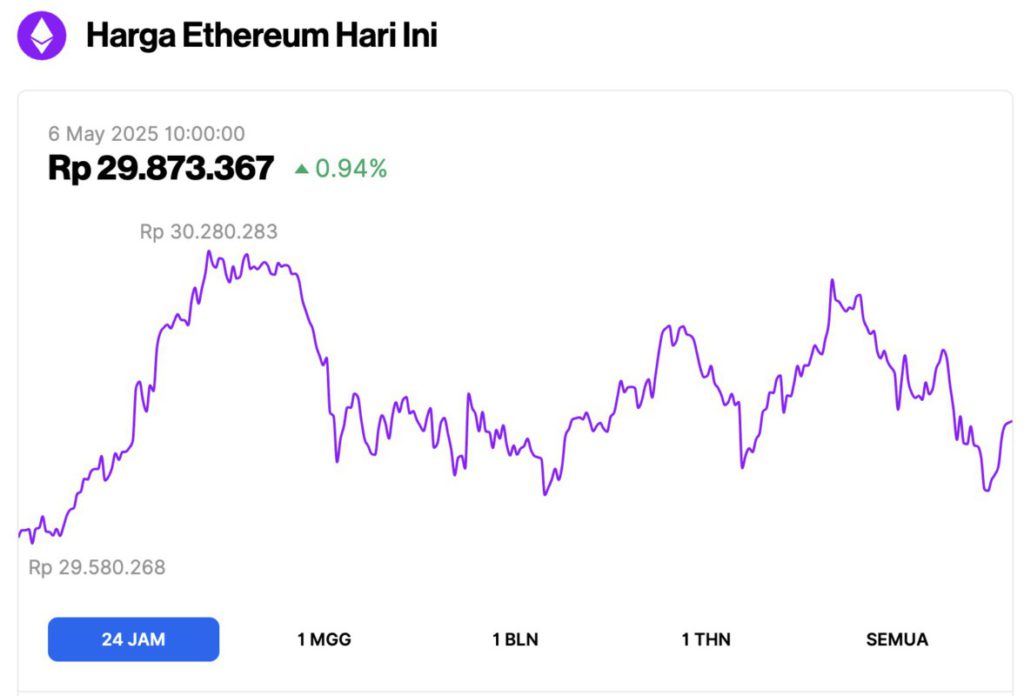
As of May 6, 2025, Ethereum (ETH) was trading at approximately $1,801, or around IDR 29,873,357, marking a 0.94% increase over the past 24 hours. Within that time frame, ETH hit a low of IDR 29,580,268 and climbed to a high of IDR 30,280,283.
At the time of writing, data from CoinMarketCap shows that Ethereum’s market capitalization stands at around $217.4 billion, with daily trading volume rising 14% to $11.27 billion in the last 24 hours.
Read also: Bitcoin Holds Strong at $94K — Is a Massive Bull Run Just Around the Corner? (May 6)
Ethereum Price Analysis
On the 4-hour chart (5/5/25) yesterday, Ethereum’s price movement showed an upward breakout above the short-term descending resistance trend line. This breakout allowed ETH to break the 61.80% Fibonacci level at $1,834.
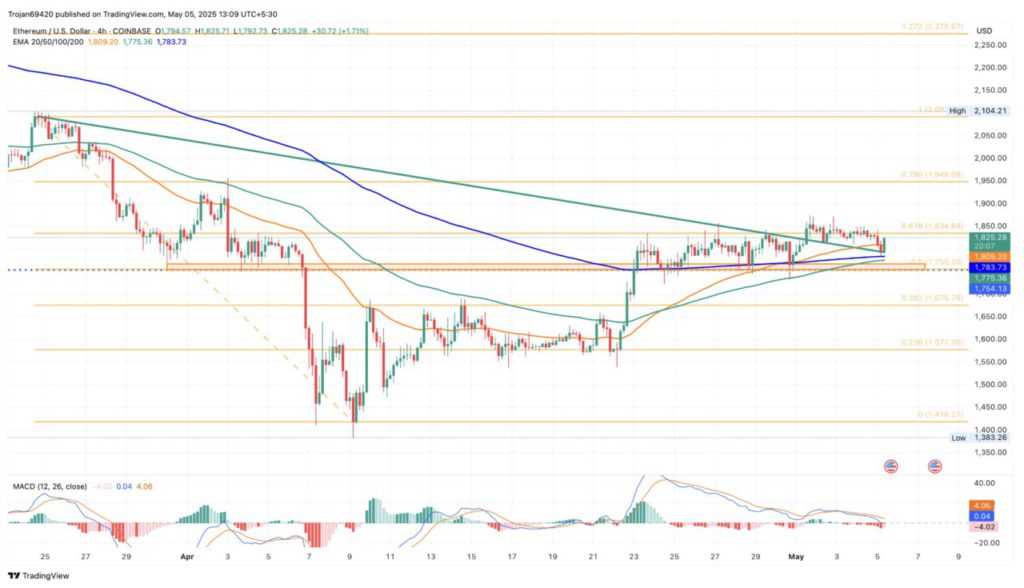
However, due to the broader market correction over the weekend, Ethereum retested the broken resistance line. After bouncing, ETH gained about 1.5% in the last 4 hours, forming a bullish engulfing candle pattern and getting back above its 50 exponential average line (50 EMA).
Also, the price’s rejection at the lower level signals strong bullish support around the 200 EMA line. As the uptrend continues, the 100 EMA and 200 EMA lines are set to form a bullish crossover.
Nonetheless, the recent correction led to the formation of a bearish crossover between the MACD line and the signal line. The moving averages started approaching the negative area due to weak bullish momentum.
However, a bullish crossover on the MACD indicator is likely if the post-reversal rally continues to strengthen. Based on Fibonacci levels, a break above 61.80% indicates a potential upside to the 78.60% level at $1,948.
Optimistically, this opens up the opportunity for Ethereum to reach the $2,000 psychological level, which is in line with the 100% Fibonacci retracement level. On the downside, crucial support is at the 50% Fibonacci level around $1,755.
This demand zone has been the area of multiple price bounces during late April. In the event of a downward breakout, ETH could potentially retest key support at $1,577.
Read also: Litecoin ETF Approval Chances Increase, $500 Target Price Awaits!
Analyst says it’s a good time to accumulate ETH amid low valuation
Ahead of Ethereum’s Pectra upgrade scheduled for May 7, on-chain data suggests a potential reversal to a bullish trend.
In a recent tweet, analyst Michael van de Poppe mentioned that Ethereum’s valuation is currently near the lowest point in its history.
Referring to the MVRV Z-score indicator, the analyst highlighted several periods of low Ethereum valuations in the past, such as when the price bottomed in August 2022, the COVID-induced market crash in March 2020, and the major correction in January 2019.
Each of these historical corrections was followed by a significant recovery within 12 months. With ETH’s current valuation still low, analysts think this could be a strong moment for asset accumulation.
Return of Ethereum Whale Activity
With Ethereum still trading at a relatively low valuation, the whales have started to accumulate again.
Based on data from Arkham Intelligence, a previously dormant wallet has now re-entered the market to buy ETH.
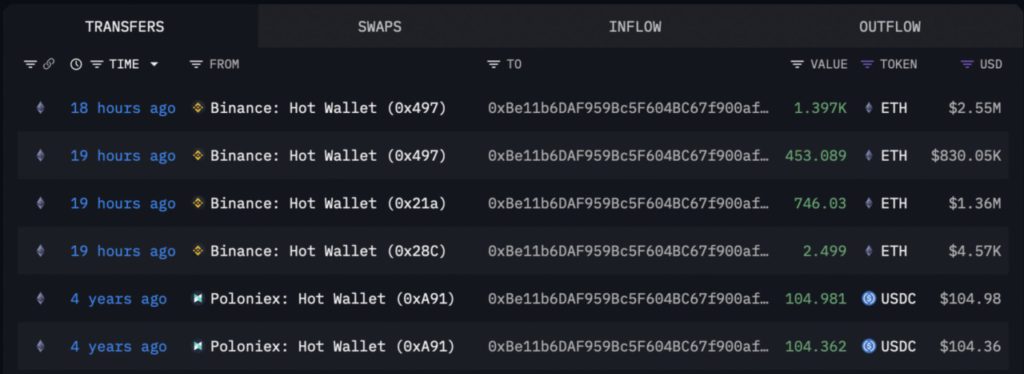
After being dormant for four years, a whale wallet with the address 0xBE11 withdrew about 2,600 ETH from Binance, worth about $4.72 million.
Additional data from IntoTheBlock shows that the concentration of ownership by whales increased sharply in the last three months. The total ETH held by whales rose from 61.69 million to 67.47 million ETH, which now accounts for 46.3% of the total circulating supply.
Read also: 3 Reasons Dogecoin Could Hit $0.40 in May 2025
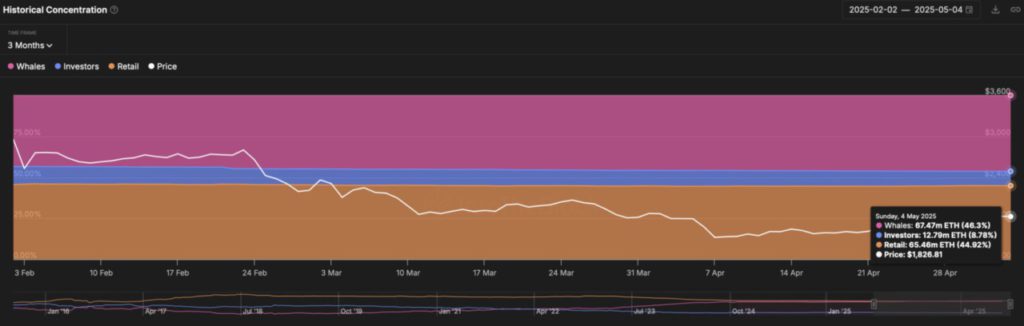
On the other hand, the concentration of ownership by investors and retailers decreased. Ownership by investors decreased from 10.92% to 8.78%, while ownership by retail investors decreased from 45.57% to 44.92%.
That’s the latest information about crypto. Follow us on Google News to stay up-to-date on the world of crypto and blockchain technology.
Enjoy an easy and secure crypto trading experience by downloading Pintu crypto app via Google Play Store or App Store now. Get a web trading experience with advanced trading tools such as pro charting, various types of order types, and portfolio tracker only at Pintu Pro. Pintu Pro Futures is also available, where you can buy bitcoin leverage, trade btc futures, eth futures and sol futures easily from your desktop!
*Disclaimer
This content aims to enrich readers’ information. Pintu collects this information from various relevant sources and is not influenced by outside parties. Note that an asset’s past performance does not determine its projected future performance. Crypto trading activities have high risk and volatility, always do your own research and use cold cash before investing. All activities of buying and selling bitcoin and other crypto asset investments are the responsibility of the reader.
Reference:
- The Crypto Basic. Ethereum Targets $2,000 as Whales Accumulate Ahead of Pectra Upgrade. Accessed on May 6, 2025