Ripple (XRP) Price Surges, New Upside Potential Wide Open!
Jakarta, Pintu News – After finding support at $2,080, the price of Ripple is now showing an impressive recovery. By successfully breaking through several resistance levels, the digital currency is now potentially facing more upside momentum.
Ripple (XRP) Price Recovery
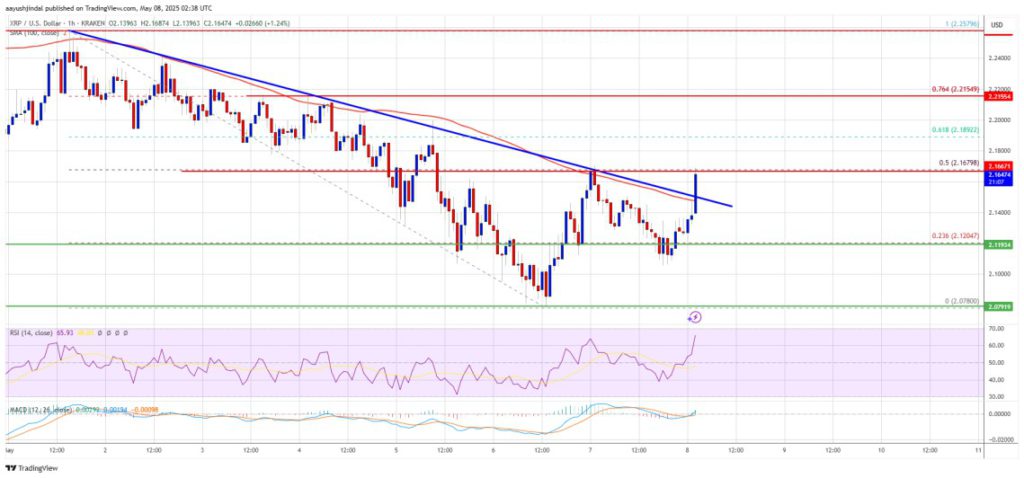
Ripple (XRP) managed to maintain its position above the $2,080 level and started a new recovery wave. This rise was driven by the price’s ability to cross the $2.10 and $2.120 levels. There was also a break above the bearish trend line with resistance near $2.1450 on the hourly chart of the Ripple (XRP)/USD pair. This signals that buyers are now taking control of the market.
Furthermore, the price of Ripple (XRP) managed to cross the 23.6% Fibonacci retracement level of the move down from the high of $2.2580 to the low of $2.078. Now, the price is trading above $2,150 and the 100-hour simple moving average. If this trend continues, Ripple (XRP) might test resistance near $2.1680 and the 50% Fibonacci retracement level of the same drop.
Also Read: Can Gaming PCs be Used to Mine Bitcoin (BTC)? Here are the Facts in 2025
Potential Resistance and Further Upside
The first major resistance is near the $2,180 level. If the price manages to cross this resistance, the next step would be to test the $2.20 level. A clear break above the $2.20 resistance could push the price towards the $2.220 level. A further rise might take the price towards $2,250 or even $2,30 in the short term. The next major obstacle for the buyers is at the $2,320 level.
Possible Price Drop
However, if Ripple (XRP) fails to break the $2.180 resistance zone, the price may see another drop. Initial support on the downside is near the $2,1320 level. The next major support is at $2,120. In case of a downward breakout and close below the $2,120 level, the price could continue to drop towards the $2,080 support. The next major support lies in the $2,050 zone.
Technical Indicators
The hourly Moving Average Convergence Divergence (MACD) indicator for Ripple (XRP)/USD is now showing increased momentum in the bullish zone. Meanwhile, the hourly Relative Strength Index (RSI) for Ripple (XRP)/USD is now above the 50 level, signaling strength on the buyers’ side.
Conclusion
With strong support and a break of key resistance, Ripple (XRP) shows potential for more upside. However, investors should remain wary of a possible decline if the key resistance is not successfully broken.
Also Read: Robert Kiyosaki Highlights Potential Market Crisis, Calls Bitcoin (BTC) Superior to Gold
That’s the latest information about crypto. Follow us on Google News for the latest crypto and blockchain technology updates. Enjoy an easy and secure crypto trading experience by downloading Pintu crypto app via Google Play Store or App Store now.
Experience web trading with advanced trading tools such as pro charting, various order types, and portfolio tracker only at Pintu Pro. Pintu Pro Futures is also available, where you can buy bitcoin leverage, trade btc futures, eth futures and sol futures easily from your desktop!
*Disclaimer
This content aims to enrich readers’ information. Pintu collects this information from various relevant sources and is not influenced by outside parties. Note that an asset’s past performance does not determine its projected future performance. Crypto trading activities are subject to high risk and volatility, always do your own research and use cold hard cash before investing. All activities of buying andselling Bitcoin and other crypto asset investments are the responsibility of the reader.
Reference
- NewsBTC. XRP Price Breaks Resistance at $2,150. Accessed on May 8, 2025.
- Featured Image: FXL Leaders