Bitcoin Stalls at $102K — But a Bullish Pattern Could Send It Soaring to $150K!

Jakarta, Pintu News – Bitcoin supporters have welcomed major developments in tariff talks between the US and China, pushing the crypto’s price up beyond $105,700 on May 12-the highest level in four months.
This increase further strengthens the signal of bullish continuation, with the next price target projected to reach $150,000. Then, how will Bitcoin price move today?
Bitcoin Price Drops 1.75% in 24 Hours
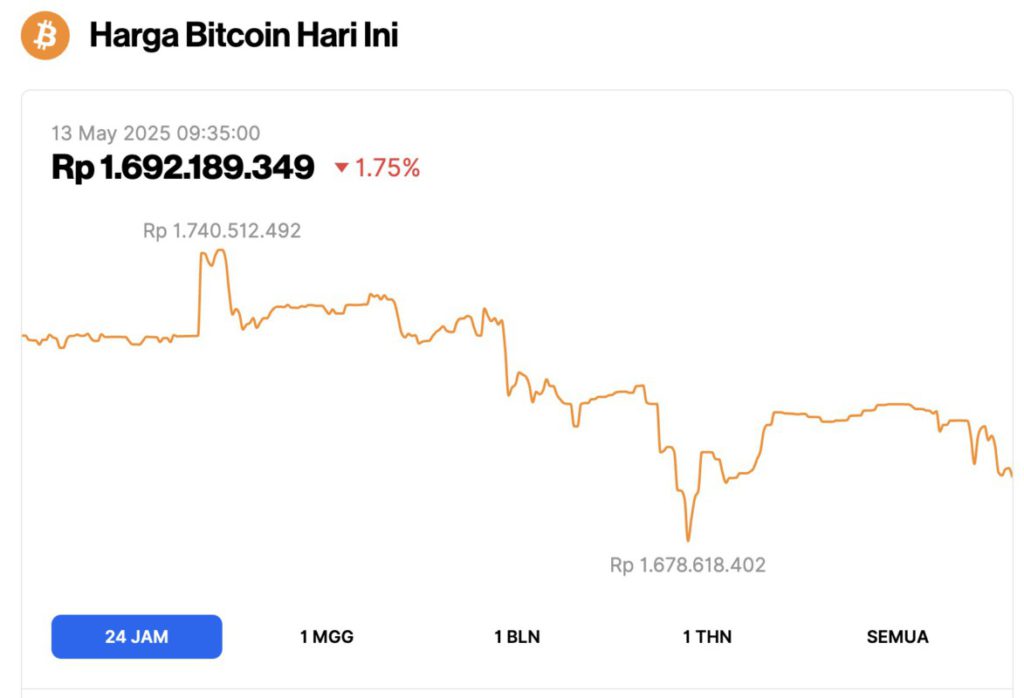
Although Bitcoin has seen gains in recent times, as of May 13, 2025, its price stood at $102,077 (approximately IDR 1,692,189,349), marking a 1.75% decline over the past 24 hours. Within this period, BTC reached a high of IDR 1,740,512,492 and dipped to a low of IDR 1,678,618,402.
According to CoinMarketCap, Bitcoin’s market capitalization now stands at around $2.02 trillion, with trading volume in the last 24 hours also up 32% to $62.3 billion.
Read also: Standard Chartered Prediction: Bitcoin (BTC) to Hit a New Record High of $120,000!
US-China trade truce triggers bitcoin surge
The main trigger for Bitcoin’s price surge this time seems to come from the easing of trade tensions between the United States and China.
Over the weekend, US Treasury Secretary Scott Bessent and Chinese Vice Premier He Lifeng reached an agreement in Geneva to lower tariffs that have paralyzed trade between the two countries for months.
Under the deal, the US will lower tariffs on imported goods from China from 145% to 30%. Meanwhile, China will cut import duties on products from the US from 125% to 10%.
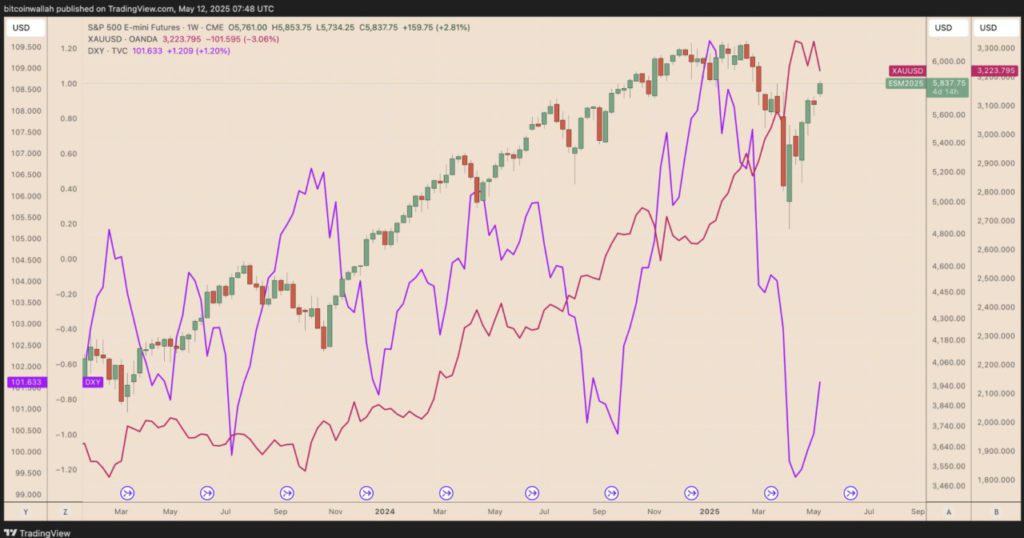
This agreement triggered a broad market rally. S&P 500 index futures rose 2.8%, while the value of the US dollar strengthened 0.7%. In contrast, gold prices fell 2.3%, signaling a shift away from safe havens.
Bitcoin, which is often considered a high-beta asset, was previously hit by the trade war as investors became more cautious and inflows into crypto assets decreased.
Now, the ceasefire signals improved liquidity and risk appetite-two factors that have historically supported BTC price rallies.
Bull Flag Pattern Breakout Hints at Bitcoin’s $150,000 Target
Bitcoin’s current rally follows the classic bull flag pattern on the weekly chart-an uptrend continuation pattern that forms when the price consolidates down in a parallel channel after a sharp upward spike.
In the case of Bitcoin, the flag pattern started forming after BTC peaked at almost $110,000 in January. This consolidation lasted for several months until early May, when the price broke the upper trendline of the flag pattern with a moderate increase in volume.
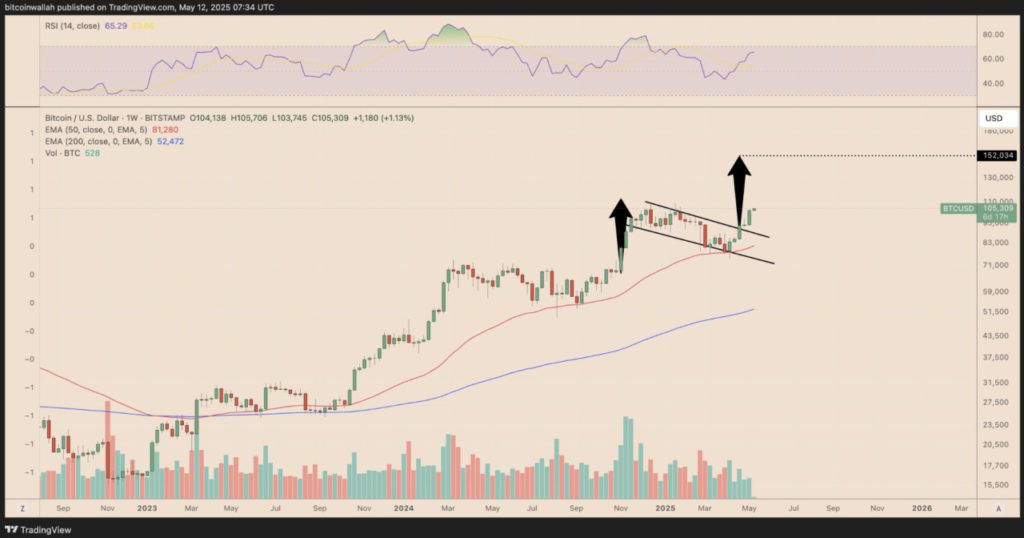
This breakout confirms the continuation of the uptrend, with the price target based on this pattern estimated to be close to $150,000. The target is calculated by adding the height of theflagpole to the breakout point.
Momentum indicators such as the relative strength index (RSI) also support this bullish direction. The weekly RSI has now climbed back above the 65 level, indicating that buying pressure has strengthened again without entering the overbought region above 70.
Read also: 3 US Cryptos to Watch If the Fed Hints at a Rate Cut in June!
BTC May Fall to $100,000 Before Rising Again
Some analysts are calling for caution as sentiment towards Bitcoin is starting to show signs of excessive euphoria.
André Dragosch, Head of European Research at Bitwise, noted that the company’s Cryptoasset Sentiment Index has reached its highest level since November 2024-a level that previously often signaled a short-term market peak.
Historical data shows that sentiment peaks such as those in April 2022, October 2023, and November 2024 are often followed by short-term price corrections or flat movements.
This suggests that the heightened optimism may have gotten too high, increasing the risk of a near-term correction even though Bitcoin’s long-term outlook remains positive.
As of May 12, 2025, Bitcoin’s price started to decline after touching above $107,000, while the daily RSI showed an alarming overbought condition.
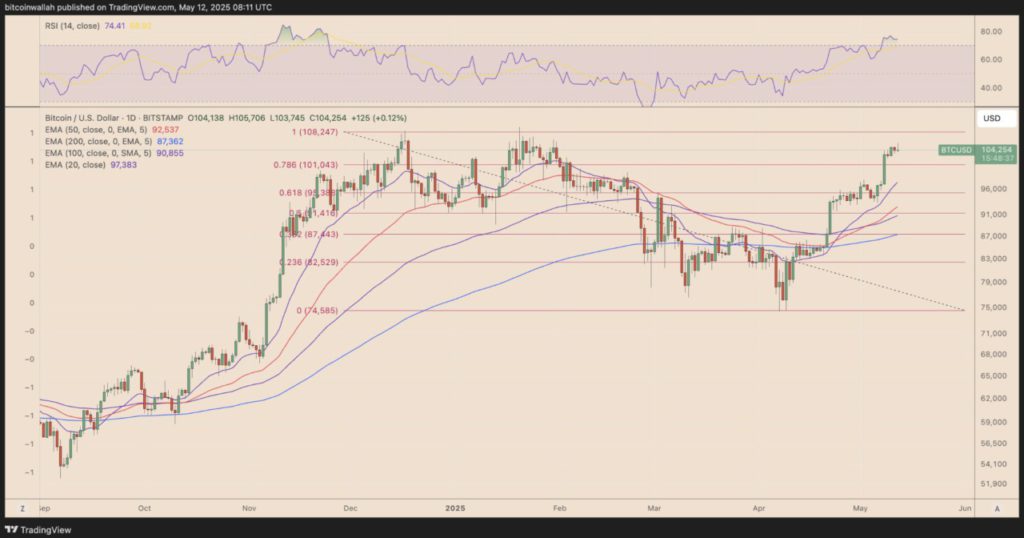
The nearest support target is around $100,000, which also coincides with the 0.786 Fibonacci retracement line.
If BTC falls below this level significantly, prices could potentially test the support of the exponential moving average (EMA), with the 20-day EMA (purple line) being the initial downside target around $97,385.
That’s the latest information about crypto. Follow us on Google News to stay up-to-date on the world of crypto and blockchain technology.
Enjoy an easy and secure crypto trading experience by downloading Pintu crypto app via Google Play Store or App Store now. Also, experience web trading with advanced trading tools such as pro charting, various types of order types, and portfolio tracker only at Pintu Pro. Pintu Pro Futures is also available, where you can buy bitcoin leverage, trade btc futures, eth futures and sol futures easily from your desktop!
*Disclaimer
This content aims to enrich readers’ information. Pintu collects this information from various relevant sources and is not influenced by outside parties. Note that an asset’s past performance does not determine its projected future performance. Crypto trading activities have high risk and volatility, always do your own research and use cold cash before investing. All activities of buying and selling bitcoin and other crypto asset investments are the responsibility of the reader.
Reference:
- BeInCrypto. Bitcoin Breaks $105,000 as Truce Between US and China Sparks Market Optimism. Accessed on May 13, 2025
- Cointelegraph. Bitcoin set for $150K BTC price rally as US, China agree to slash tariffs. Accessed on May 13, 2025