Pi Network Ready to Explode? Triple bottom pattern hints at 35% price surge

Jakarta, Pintu News – The Pi Network (PI) price is consolidating around US$0.64 or around Rp10,400 (at US$1 = Rp16,256). Despite a 2.35% decline this month, technical data indicates a strong “triple bottom” pattern, signaling significant upside potential.
Analysts expect a surge of up to 35% if the price is able to break through an important resistance level. This situation caught the attention of the cryptocurrency community as this technical pattern is often the beginning of a strong trend reversal.
Declining Volatility, a Sign Before a Price Spike?
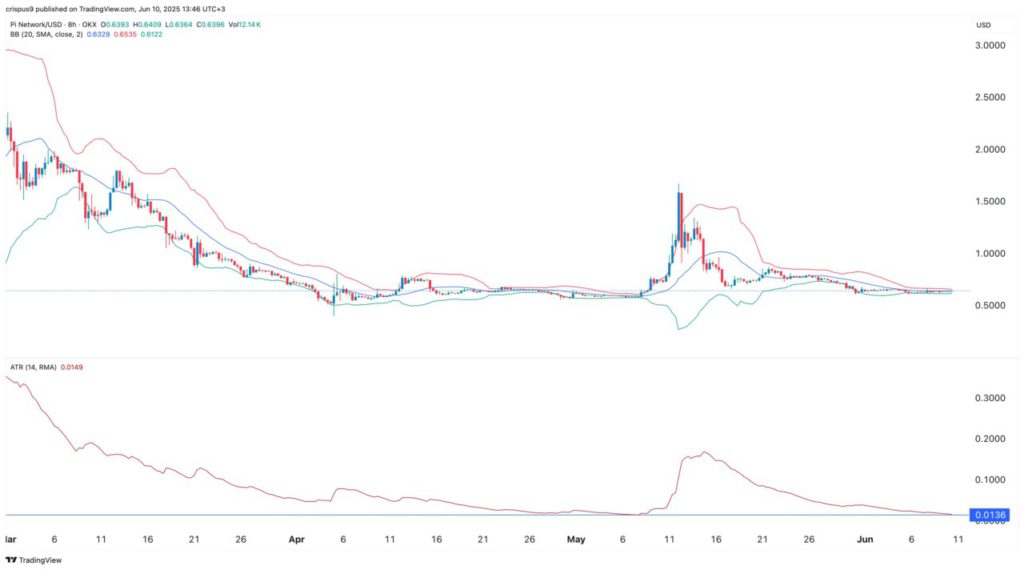
Technical indicators such as Bollinger Bands show that the Pi Network’s price volatility has been decreasing in recent weeks. This phenomenon is known as “price coiling” where prices move in narrow ranges and are often followed by sharp breakouts. A similar situation had occurred in April to May 2025, when PI prices spiked dramatically after a period of low volatility.
The Average True Range (ATR) indicator, which measures the average price movement, also dropped to its lowest level since May 7, at 0.0136. This confirms that the Pi Network’s price movement is in a calm phase before a potential big move. In a technical context, this is usually considered a tipping point that determines the direction of the next trend. However, even if the technical signals are in favor of a surge, the direction of the breakout is still not fully confirmed.
Also Read: Circulating! Critic Michael Saylor’s Equal-Sized Critique of Bitcoin Strategy
Triple Bottom Pattern: Trend Reversal Signal?
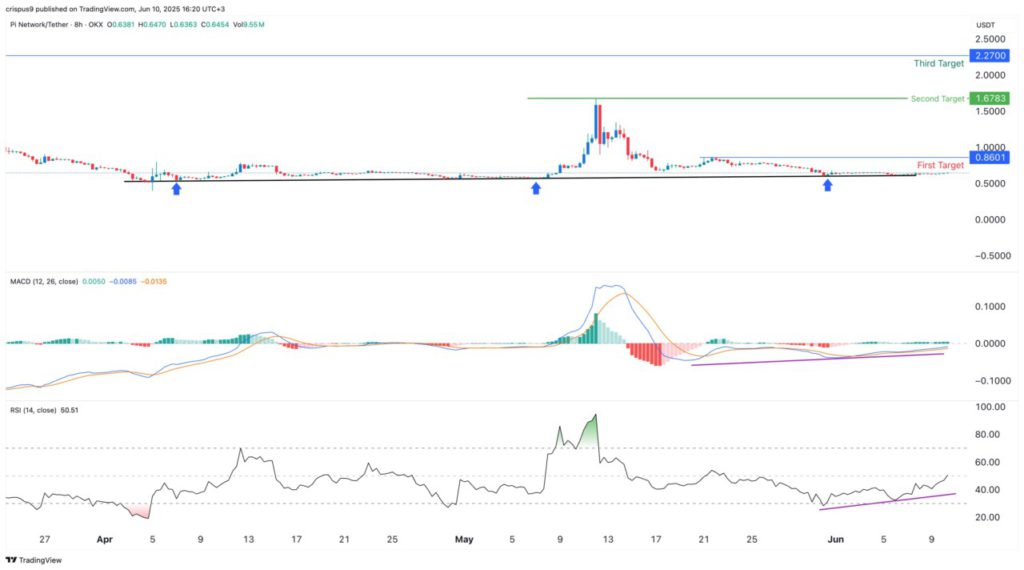
The triple bottom pattern seen on the 8-hour chart shows three lows that form a strong price floor. The neckline of this pattern is around US$1.67 (approx. IDR27,150), and if the price manages to break out of that level, a breakout pattern will be confirmed. The theoretical target of this pattern reaches US$2.74 or about IDR44,590.
However, before reaching that level, Pi Network has to face several resistances, such as at US$0.86 (IDR13,980), US$1.00 (IDR16,256), and US$1.67. Each of these points is an important level that was previously the peak of the price. With the strength of momentum and accumulation continuing to occur, many analysts estimate the potential for success in breaking through these levels is quite significant, although it remains dependent on the overall market response.
Momentum Indicators and Blockchain Data Support the Rise
Two key momentum indicators, the Relative Strength Index (RSI) and the Moving Average Convergence Divergence (MACD), are showing bullish divergence. This occurs when the indicators show upward strength while the price remains down, signaling buying pressure that has not been reflected in the price. This divergence is usually followed by a trend reversal if confirmed by increased trading volume.
On the on-chain side, data from PiScan shows a withdrawal of over 72,720 PI tokens from exchanges in the last 24 hours. This could be interpreted as a sign of accumulation by long-term investors reducing supply on exchanges. A decrease in supply on the open market is often a trigger for price increases, especially when accompanied by positive sentiment from the crypto community and potential listings on major exchanges.
Downside Risks Remain, but Technical Signals are Positive
Although the current outlook is bullish, it is important to pay attention to the opposite scenario. If PI prices fall below US$0.60 (IDR9,753), the triple bottom pattern will fail and trigger a 30% correction towards the historical support level of US$0.40 (IDR6,502). Thus, the US$0.60 level becomes a crucial boundary that will determine the short-term price direction.
Investors and traders are advised to keep a close eye on price movements and trading volumes, as well as fundamental developments such as project announcements or the integration of new exchanges. In the cryptocurrency market, sentiment can change quickly and is highly dependent on global dynamics and technological developments.
Conclusion
Pi Network is currently at an important junction. Technical patterns suggest the potential for a significant trend reversal, but risks need to be taken into account. With the support of strong technical indicators and on-chain data, the opportunity for price spikes remains wide open. However, investment decisions still need to be made with careful consideration and good risk management.
Also Read: MicroStrategy Stock Strategies Beat Bitcoin and Tech Giants Over the Year
That’s the latest information about crypto. Follow us on Google News for the latest crypto and blockchain technology updates. Enjoy an easy and secure crypto trading experience by downloading Pintu crypto app via Google Play Store or App Store now.
Experience web trading with advanced trading tools such as pro charting, various order types, and portfolio tracker only at Pintu Pro. Pintu Pro Futures is also available, where you can buy bitcoin leverage, trade btc futures, eth futures and sol futures easily from your desktop!
*Disclaimer
This content aims to enrich readers’ information. Pintu collects this information from various relevant sources and is not influenced by outside parties. Note that an asset’s past performance does not determine its projected future performance. Crypto trading activities are subject to high risk and volatility, always do your own research and use cold hard cash before investing. All activities of buying andselling Bitcoin and other crypto asset investments are the responsibility of the reader.
Reference
- Crispus/Coingape. Pi Network Price Coils Up as Triple Bottom Pattern Hints at 35% Surge. Accessed June 11, 2025.
- Featured Image: Coinpedia