Axelar Skyrockets 80% After Upbit Listing – Is This the End of Its Months-Long Downtrend?

Jakarta, Pintu News – AXL, the native token of the Axelar cross-chain protocol, has broken the downward trend of the past few months by surging 80% on June 10. The trigger for this increase was a new listing on the Korean exchange, Upbit, which reignited market interest.
Following the listing announcement on Upbit, the price of AXL reached $0.58 – a level last seen in December. Trading volumes also jumped sharply, pushing AXL closer to breaking into the top 100 cryptocurrencies.
Here is an explanation of how this spike happened and how AXL’s price movement is predicted in the short term, according to CCN.
Crypto Axelar Breaks the Falling Wedge Pattern
On the weekly chart, the price of AXL has continued to record lower highs since December 9, 2024. The image below also shows that the altcoin is experiencing lower lows, forming a falling wedge pattern.
Read also: Solana ETF Approved by SEC Soon? SOL Surges to $165!
However, as of June 10, 2025, South Korean exchange Upbit announced that it had listed the token against the Korean Won (KRW) at 16:00 KST.
After the announcement, the price of Axelar tokens immediately broke through the upper boundary of the falling wedge pattern. Along with this movement, the Moving Average Convergence Divergence (MACD) indicator was also above the zero line.
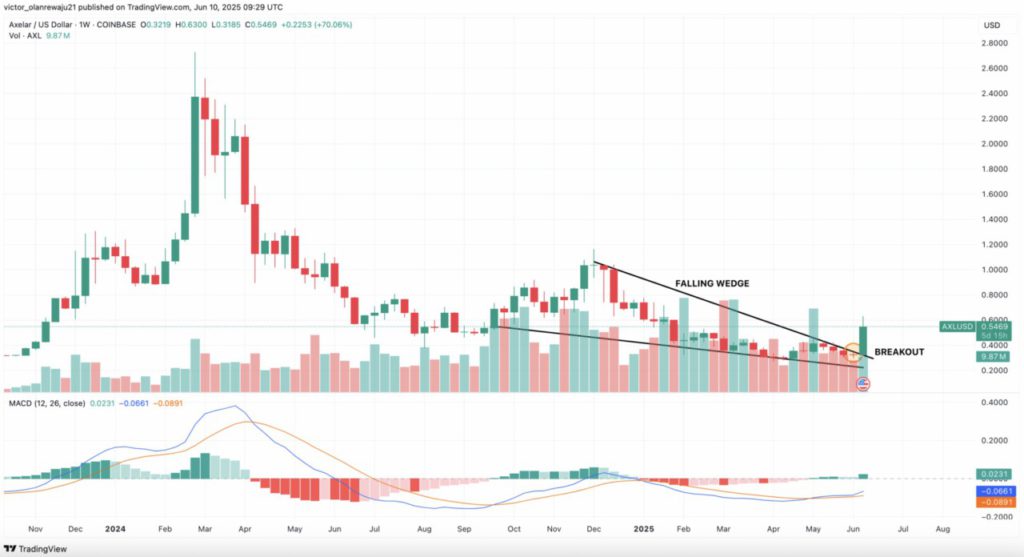
This indicates that there is bullish momentum (uptrend) on AXL. If this trend continues, then the price of AXL will most likely go higher and potentially approach the $1 level.
Crypto Axelar volume soars 2000% as demand rises
In addition to the falling wedge pattern breakout, on-chain data also supports AXL’s price rally. Trading volume jumped dramatically from $18.65 million yesterday to $366.43 million today – an increase of over 2000%.
As expected, Axelar’s listing on Upbit triggered a surge of interest from the Asian region, pushing demand up sharply.
If this surge in trading volume continues, it could provide additional fuel to push AXL prices higher and reinforce the ongoing uptrend.
Furthermore, data from Santiment showed that the price Daily Active Addresses (DAA) divergence metric jumped into significant positive territory. This metric is used to gauge whether user activity is strong enough to support price trends.
A rise in price DAA divergence signals increased user engagement, which is a bullish signal. Conversely, a decrease indicates waning interest and potential downward pressure.
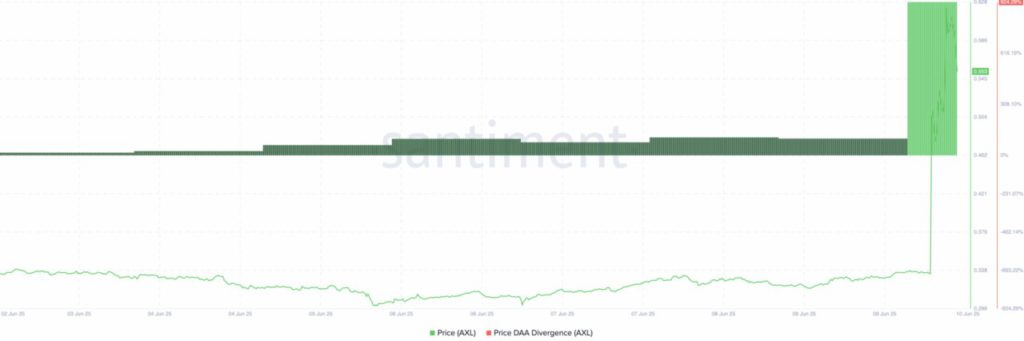
As of June 10, the price DAA divergence was recorded at 924.29%, indicating a huge spike in network activity. If this momentum holds, it could be the driving force that takes AXL’s price even higher.
Read also: 3 Cryptos that Investors Are Grabbing as the 2025 Crypto Bull Run Begins!
Axelar Crypto Price Prediction: Further Upside Potential
For the short-term outlook, CCN analyzed the daily chart of AXL. Since May 12, the price of AXL is trapped in a descending triangle pattern with horizontal support levels around $0.30.
But now, AXL managed to break the upper trend line of the triangle pattern, reversing the bearish structure to signal a bullish trend reversal. On the other hand, the Chaikin Money Flow (CMF) indicator also started to rise and approached the zero line.
If CMF manages to enter the positive zone, AXL has the potential to break the resistance at $0.61. In addition, the Money Flow Index (MFI) indicator – which measures buying and selling pressure – is also showing an upward trend, signaling strong accumulation.
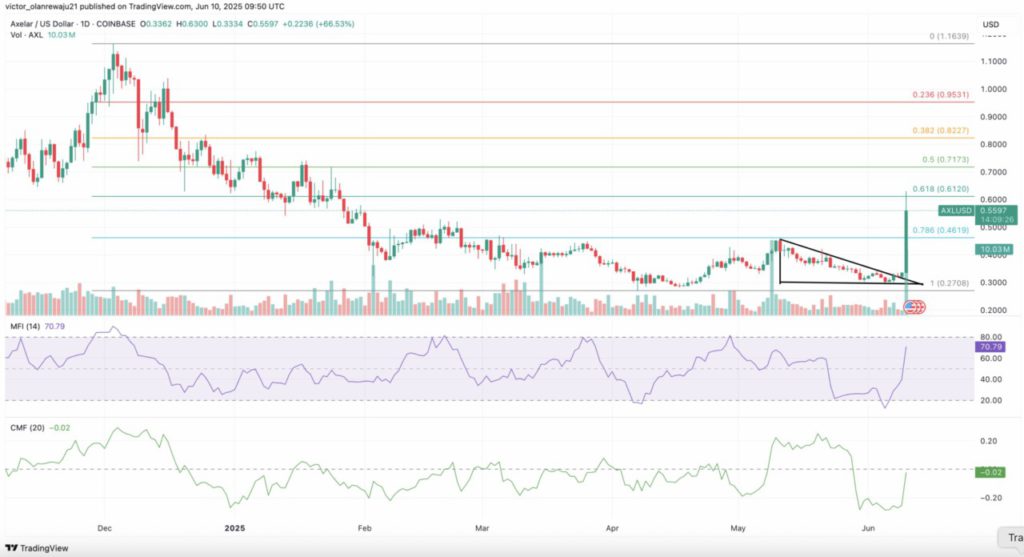
If this trend continues, a further price push seems very likely. Based on the Fibonacci retracement levels, the next target for AXL is estimated to be $0.82 at 0.382.
However, if selling pressure starts to increase, the price of AXL could drop back to support at $0.46. In an extreme bearish scenario, the price could even fall below $0.30.
That’s the latest information about crypto. Follow us on Google News to stay up-to-date on the world of crypto and blockchain technology.
Enjoy an easy and secure crypto trading experience by downloading Pintu crypto app via Google Play Store or App Store now. Also, experience web trading with advanced trading tools such as pro charting, various types of order types, and portfolio tracker only at Pintu Pro. Pintu Pro Futures is also available, where you can buy bitcoin leverage, trade btc futures, eth futures and sol futures easily from your desktop!
*Disclaimer
This content aims to enrich readers’ information. Pintu collects this information from various relevant sources and is not influenced by outside parties. Note that an asset’s past performance does not determine its projected future performance. Crypto trading activities have high risk and volatility, always do your own research and use cold cash before investing. All activities of buying and selling bitcoin and other crypto asset investments are the responsibility of the reader.
Reference:
- CCN. Axelar (AXL) Breaks Multi-Month Downtrend With Explosive 80% Move Fueled by Upbit Listing. Accessed on June 11, 2025


