XRP Prepares for a Surge: Why Golden Cross is Key?
In recent days, the price of Ripple has shown impressive performance by holding above $2.20. With trading volumes increasing by 14% in the last 24 hours, reaching $3 billion, various technical indicators are now in the spotlight. This momentum signals a pivotal point for the future of Ripple (XRP), with the potential for significant price movements in the cryptocurrency market.
Ripple (XRP) Relative Strength Index: Are There Opportunities for Further Movement?
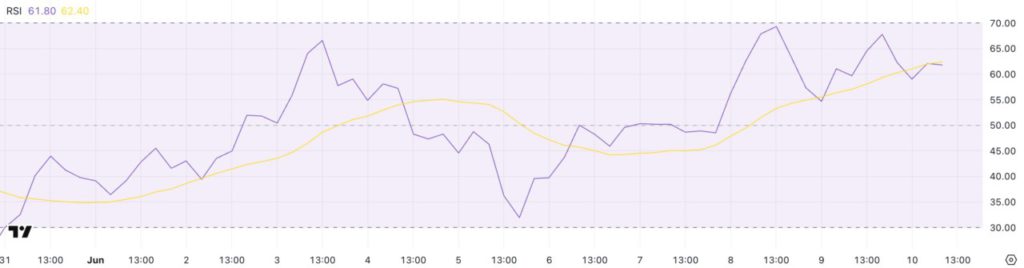
The Relative Strength Index (RSI) of Ripple (XRP) is currently at 61.6, indicating a condition that is neither overbought nor oversold. Over the past two days, the RSI of Ripple (XRP) has stabilized in the range of 55 to 70. This suggests that there is still room for Ripple (XRP) to move up without experiencing significant selling pressure.
This RSI condition in the ‘sweet’ zone indicates that Ripple (XRP) is in a stable condition but still has the potential to increase. Investors and traders should keep an eye on these RSI numbers, as significant changes could be an early indicator of larger price movements.
Also Read: Circulating! Critic Michael Saylor’s Equal-Sized Critique of Bitcoin Strategy
Ichimoku Cloud Shows Positive Trend
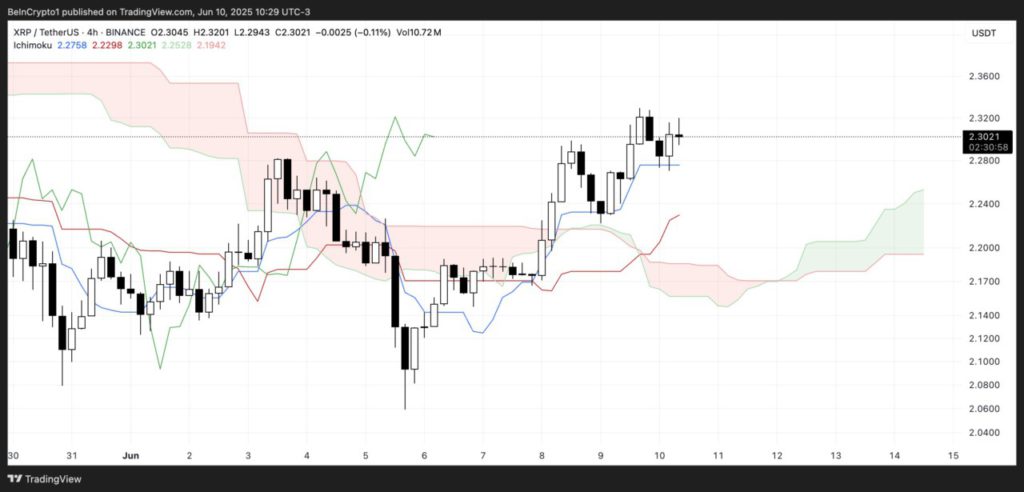
Ichimoku Cloud analysis for Ripple (XRP) shows a bullish picture. The price candles are currently above the red and blue lines, which are strong indicators of an uptrend. This suggests that Ripple (XRP) has strong support at the current price level and is likely to continue rising if market conditions are favorable.
Moreover, the position of the candles above these two lines signals that not only is there upside potential, but also that Ripple (XRP) is in a better position compared to the previous few days. This gives investors confidence that Ripple (XRP) will probably continue to show strong performance.
Golden Cross Approaching: Will Ripple (XRP) Reach $2.65?
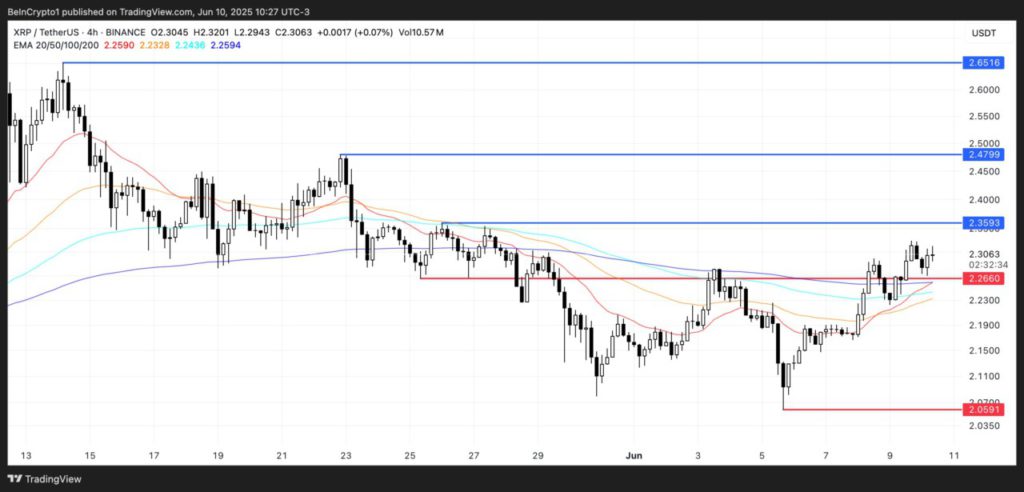
One of the most bullish signals in technical analysis is the Golden Cross formation, which seems to be forming on the Ripple (XRP) chart. A Golden Cross occurs when the short-term Exponential Moving Average (EMA) line crosses above the long-term EMA line, signaling a significant potential price increase.
If this Golden Cross forms, Ripple (XRP) could test and possibly even break the resistance level at $2.35. This would pave the way for Ripple (XRP) to reach its next price target of $2.65, providing a great opportunity for traders and investors to profit.
Conclusion
With various technical indicators showing positive signals, Ripple (XRP) is on the verge of a price move that might change the market dynamics. Observation of the RSI, Ichimoku Cloud, and potential Golden Cross formation will be key to understanding the next direction of Ripple (XRP) in the cryptocurrency market.
Also Read: MicroStrategy Stock Strategies Beat Bitcoin and Tech Giants Over the Year
That’s the latest information about crypto. Follow us on Google News for the latest crypto and blockchain technology updates. Enjoy an easy and secure crypto trading experience by downloading Pintu crypto app via Google Play Store or App Store now.
Experience web trading with advanced trading tools such as pro charting, various order types, and portfolio tracker only at Pintu Pro. Pintu Pro Futures is also available, where you can buy bitcoin leverage, trade btc futures, eth futures and sol futures easily from your desktop!
*Disclaimer
This content aims to enrich readers’ information. Pintu collects this information from various relevant sources and is not influenced by outside parties. Note that an asset’s past performance does not determine its projected future performance. Crypto trading activities are subject to high risk and volatility, always do your own research and use cold hard cash before investing. All activities of buying andselling Bitcoin and other crypto asset investments are the responsibility of the reader.
Reference
- BeInCrypto. XRP Volume Hits $3 Billion as Golden Cross Forms. Accessed on June 11, 2025
- Featured Image: Track Insight


