ETH Stabilizes at $2,500 Today — Could a Breakout to $3,237 Be Next?

Jakarta, Pintu News – Ethereum is holding around the $2,515 mark after experiencing a mild daily decline on June 20.
However, ETH still maintains its position above the $2,383 support level and is trading slightly below the neckline resistance line at $2,824.
What makes this situation interesting is the formation of an inverted head-and-shoulders pattern that fits perfectly with the technical analysis theory on the daily chart.
Before discussing further, let’s explore Ethereum’s current price movements first!
Ethereum Price Drops 0.14% in 24 Hours
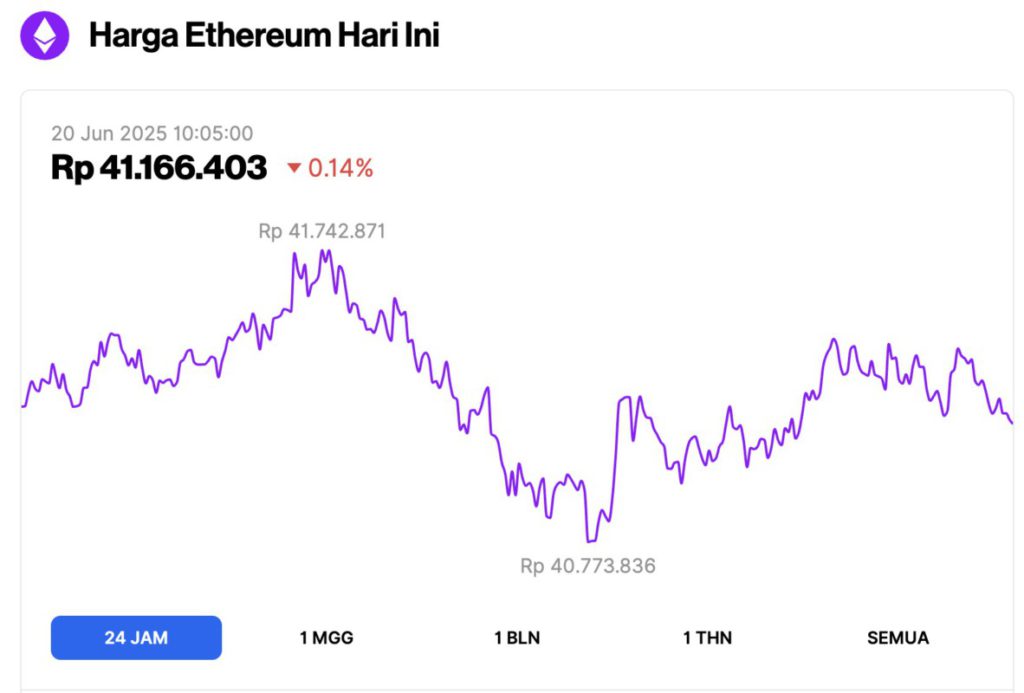
As of June 20, 2025, Ethereum was trading at approximately $2,515 (around IDR 41,166,403), marking a modest 0.14% dip over the past 24 hours. Throughout the day, ETH reached a high of IDR 41,742,871 and dipped to a low of IDR 40,773,836.
At the time of writing, data from CoinMarketCap shows that Ethereum’s market capitalization stands at around $303.62 billion, with daily trading volume dropping 45% to $11.36 billion within the last 24 hours.
Read also: 3 Free Crypto Airdrops Worth Hunting Right Now: Check out the Complete Guide!
Ethereum Head-and-Shoulders Pattern
Reporting from AMBCrypto, Ethereum’ s inverted head-and-shoulders pattern formed from early March to mid-June, characterized by higher lows and a horizontal resistance line as a neckline.
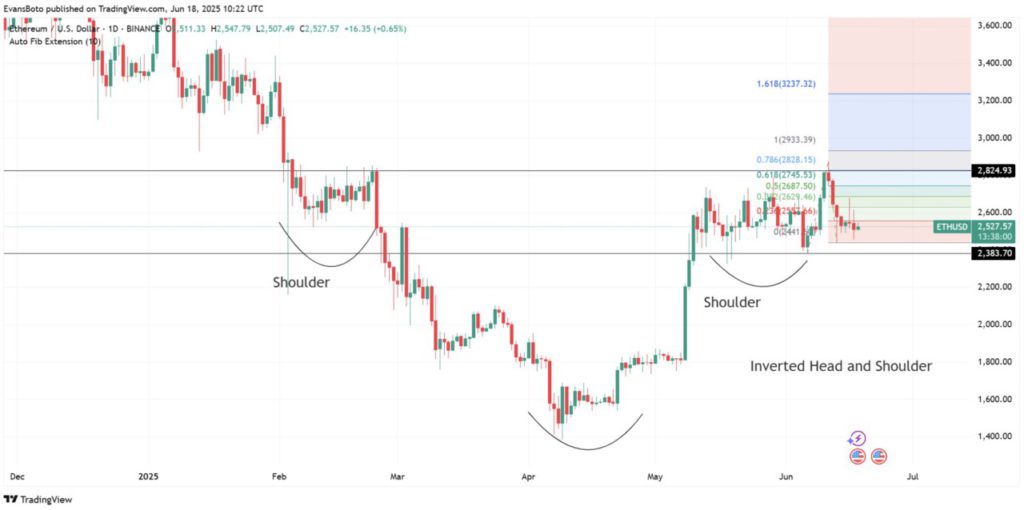
Naturally, this structure hints at a potential upside breakout-if successfully confirmed. The projected move will target the Fibonacci extension levels at $2,933 and $3,237.
However, ETH needs to close above the $2,824 level with strong momentum to activate the upside signal.
Are Long-Term Holders Still Confident?
Long-term wallet holdings remained stable in the past 30 days, indicating a neutral stance from large investors. In contrast, the number of wallets at the investor level increased by 6.46%, indicating moderate confidence from middle-class holders.
Meanwhile, retail wallet concentration was barely changed, only up +0.21%, reflecting hesitation from small investors.
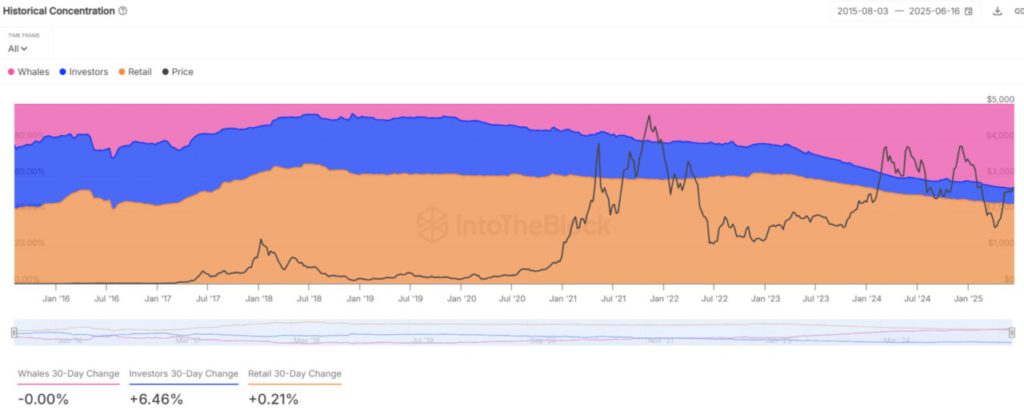
This stable distribution trend suggests that ETH supply is still tightly concentrated, which could favor a decrease in volatility until a breakout or breakdown occurs.
Significant changes in these concentrations can be decisive for the direction of market sentiment going forward.
What does the MVRV ETH Ratio Reveal about Market Position?
Currently, Ethereum’s MVRV ratio stands at 23.05%-signaling that recent buyers are still registering profits. But when viewed from a long-term perspective, a different picture emerges.
Read also: Ahead of the June 28 Major Upgrade, Pi Network is in Chaos!
The Long/Short MVRV differential is still in negative territory, at -7.71%, indicating that long-term holders are still below their average purchase price. This differential creates a sort of “psychological crossroads.”
On the one hand, short-term optimism can trigger a price rally. But on the other hand, long-term holders are usually the pillars of a sustainable trend.
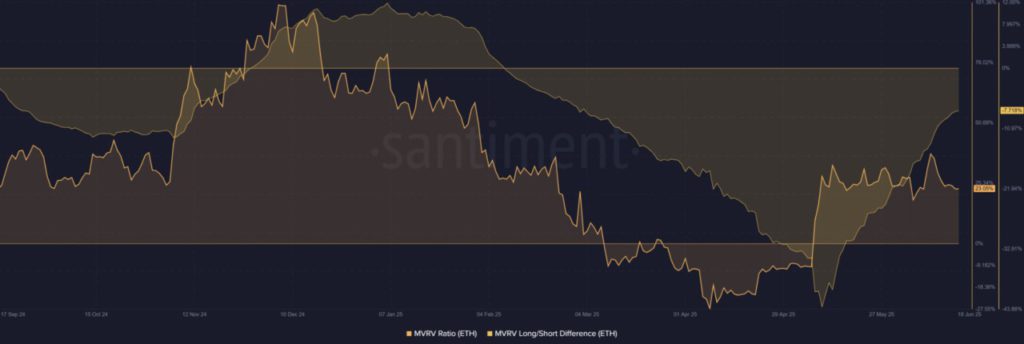
Unless this gap narrows-ideally with both metrics increasing simultaneously-ETH will likely continue to move sideways, caught between hope and doubt.
Is the Sudden Drop in Gas Usage a Sign of Concern?
Ethereum gas usage plummeted from over 65 billion to 55.06 billion, ending a long period of high network activity. This drop could indicate two things: increased efficiency or reduced on-chain demand.
While this change has not had a direct impact on the pricing structure, it does raise questions about the sustainability of user engagement on the network.
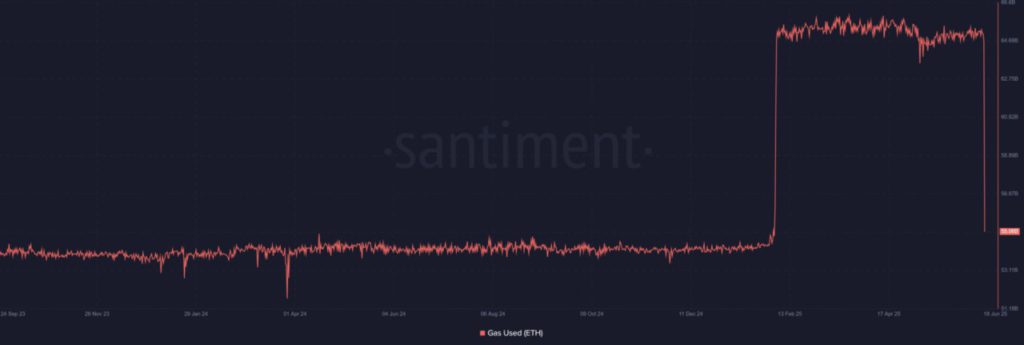
If gas usage continues to decline as address activity is low, the bullish narrative could lose impetus. However, if this is just a phase of “reset,” there is a possibility of a resurgence in activity in the near future.
Why Address Growth Shows Initial Interest but Weak Confidence?
New wallet creation increased by 9.77% in the last seven days, but the number of Active Addresses actually decreased by 1.35%. This discrepancy suggests that while more new users are coming into the ecosystem, few are actually active on a daily basis.
Discrepancies like this often arise in the early phases of a recovery, when curiosity begins to grow before confidence is fully formed. If these two metrics rise simultaneously, it would be a stronger signal for potential growth.
Read also: Funds into Bitcoin and Gold ETFs soar! UK & US ready to get into Iran-Israel War?
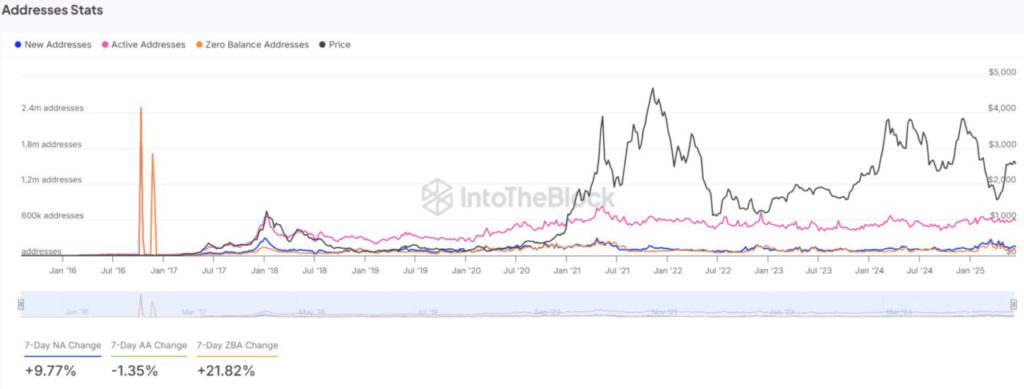
For now, this pattern reflects cautious optimism and reinforces ETH’s sideways movement tendency.
Will ETH Break $2,824 or Stay in Range?
Ethereum’s technical structure shows potential with a solid bullish pattern forming, but conflicting on-chain metrics demand caution. As long as address activity and valuations are not in line with the technical structure, ETH will most likely continue to move sideways.
In the event of a breakout above $2,824 supported by increased network participation, the price surge could be swift. But before that, the market is still waiting for stronger confirmation.
That’s the latest information about crypto. Follow us on Google News to stay up-to-date on the world of crypto and blockchain technology.
Enjoy an easy and secure crypto trading experience by downloading Pintu crypto app via Google Play Store or App Store now. Also, experience web trading with advanced trading tools such as pro charting, various types of order types, and portfolio tracker only at Pintu Pro. Pintu Pro Futures is also available, where you can buy bitcoin leverage, trade btc futures, eth futures and sol futures easily from your desktop!
*Disclaimer
This content aims to enrich readers’ information. Pintu collects this information from various relevant sources and is not influenced by outside parties. Note that an asset’s past performance does not determine its projected future performance. Crypto trading activities have high risk and volatility, always do your own research and use cold cash before investing. All activities of buying and selling bitcoin and other crypto asset investments are the responsibility of the reader.
Reference:
- AMBCrypto. Ethereum eyes $3,237 next – But is there ONE missing factor? Accessed on June 20, 2025