Ethereum Crashes to $2,200 — Is a Fall Below $2,000 Next?

Jakarta, Pintu News – After more than a month of sideways chop – that is, horizontal price movement – Ethereum moved between the support level of $2,350 and the resistance of $2,900. However, the price finally broke through this structure.
Then, how is Ethereum’s current price movement?
Ethereum Price Drops 0.99% in 24 Hours
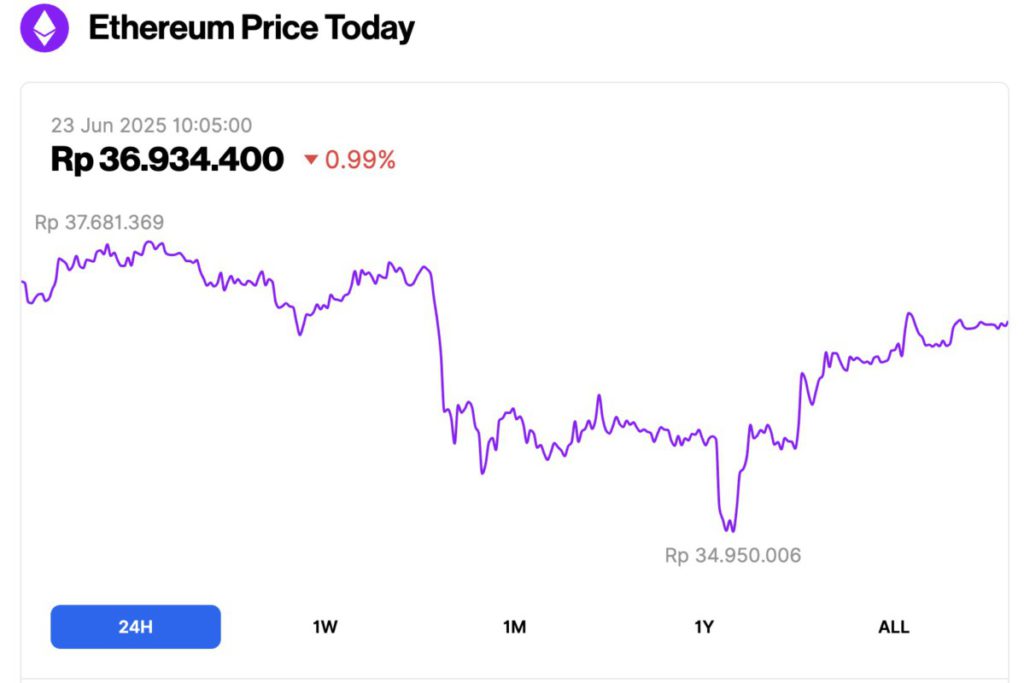
As of June 23, 2025, Ethereum was trading at approximately $2,243, or around IDR 36,934,400, marking a 0.99% drop over the past 24 hours. Within that period, ETH reached a high of IDR 37,681,369 and dipped to a low of IDR 34,950,006.
At the time of writing, data from CoinMarketCap shows that Ethereum’s market capitalization stands at around $270.57 billion, with daily trading volume rising 21% to $25.58 billion in the last 24 hours.
Read also: Bitcoin Dips to $101K — But Holders Stay Strong as Peak Warning Signs Flash!
Leverage Bulls Trapped in Rug-Pull Scenario
On June 21, ETH briefly broke the lower limit of its range with a sharp decline of 4.56%. The price touched $2,215, the lowest level in almost 50 days.
Unsurprisingly, over $250 million of long positions were liquidated as the over-leveraged bulls were caught in a classic rug-pull scenario.
At first glance, this seems like a normal process of leverage reset – a readjustmentdue to excessive leverage usage. However, the on-chain data shows differently.
According to the AMBCrypto page, there may be structural changes taking place – which could make Ethereum’s support level of $2,000 more vulnerable.
Global Tensions Rattle Markets, Ethereum Leads the Decline
In less than 72 hours, the crypto market lost almost 3.5% of its total valuation. This is a clear sign that macro FUD (fear, uncertainty, and doubt due to macroeconomic factors) is already reflected in prices.
However, the main trigger occurred when the United States officially became involved in the conflict in the Middle East, which triggered a complete breakdown of the market structure.
The market reaction was instantaneous. Risk-off sentiment surged, and capital fled. Ethereum was the biggest victim, dropping 9.16% in the same timeframe, hitting $2,215. And this was no ordinary leverage flush.
Ethereum’s Coin Years Destroyed (CYD) surged to its highest level in six months. This spike indicates that old coins that were previously dormant are suddenly back on the move.
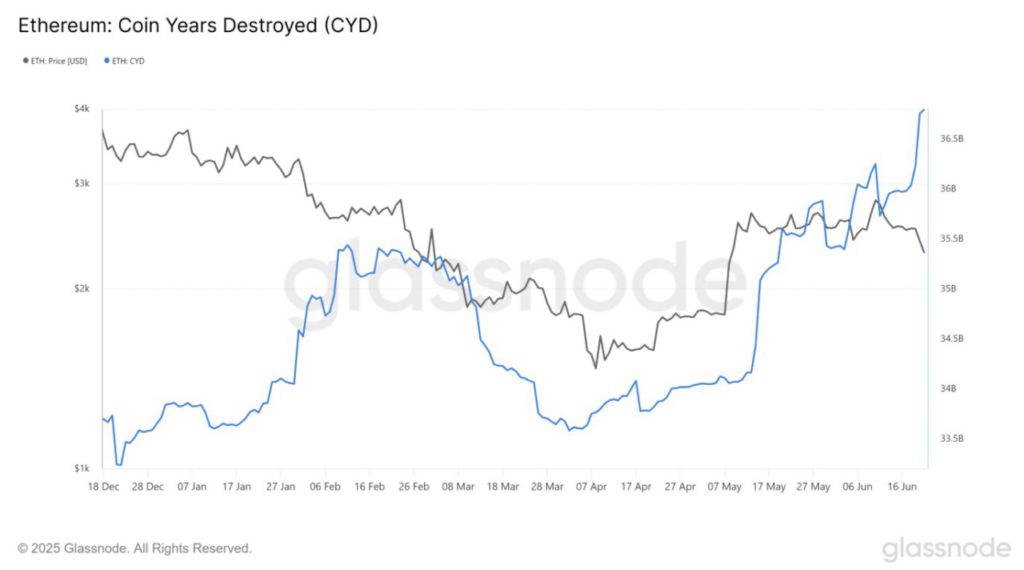
Indeed, a spike in CYD does not always signal a liquidity exit. However, this time the on-chain data provides a clearer picture.
Read also: While the Market Burns, These 3 Made in USA Cryptos Are Heating Up!
According to Lookonchain, a wallet owned by OG (a longtime and influential holder) sold 5,000 ETH at around $2,400, just before the sharp drop occurred. Meanwhile, medium-sized whales also started selling when ETH broke through an important support level.
It’s no wonder that Ethereum experienced the sharpest drop-these actions felt like a calculated move.
In other words, the timing of the sale suggests strategic exits, either to secure profits before the price drops further, or simply to break even from a previously losing position.
More importantly, it signals a psychological turning point. Long-term holders (LTHs)-which are usually the backbone of the market-are starting to show signs of losing faith.
And when the smart money started to retreat, the FOMO of retail investors had no chance to dominate.
Can ETH Survive the $2,000 Level?
From a structural point of view, Ethereum needs a drop of about 12% from the current price ($2,272) to re-test the psychologically important support level of $2,000.
However, given ETH ‘s recent sharp decline, that scenario no longer sounds impossible.
The second quarter looks set to close with high volatility. The ever-increasing geopolitical tensions have reversed market sentiment into a highly risk-off one. As long as there is no official ceasefire declaration, the market will remain vulnerable to a new wave of macro-driven FUD.
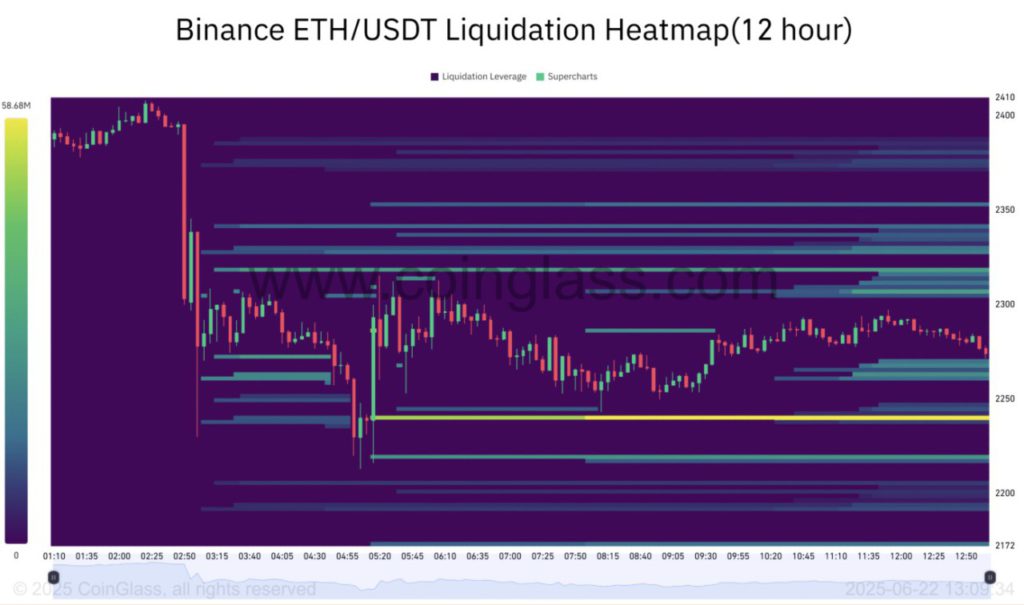
Positioning data already reflects bearish pressure. There is a $58.69 million long liquidity cluster around the $2,239 level-signaling that traders are aggressively taking short positions.
If market confidence levels remain this low, it’s only a matter of time before the next liquidity sweep occurs which could push Ethereum down below $2,200, and pave the way for a potential retest to the $2,000 zone.
That’s the latest information about crypto. Follow us on Google News to stay up-to-date on the world of crypto and blockchain technology.
Enjoy an easy and secure crypto trading experience by downloading Pintu crypto app via Google Play Store or App Store now. Get a web trading experience with advanced trading tools such as pro charting, various types of order types, and portfolio tracker only at Pintu Pro. Pintu Pro Futures is also available, where you can buy bitcoin leverage, trade btc futures, eth futures and sol futures easily from your desktop!
*Disclaimer
This content aims to enrich readers’ information. Pintu collects this information from various relevant sources and is not influenced by outside parties. Note that an asset’s past performance does not determine its projected future performance. Crypto trading activities have high risk and volatility, always do your own research and use cold cash before investing. All activities of buying and selling bitcoin and other crypto asset investments are the responsibility of the reader.
Reference:
- AMB Crypto. Ethereum faces macro crisis: Can ETH’s $2K hold? – KEY insights reveal… Accessed on June 23, 2025