3 Meme Coins to Watch as April Comes

Jakarta, Pintu News – The last week of March 2026 began to draw market participants’ attention to the meme coin sector. In the midst of a broader market correction, certain tokens showed more prominent chart structures than other assets.
The following is an analysis of three meme coins that are considered worthy of investors’ attention towards the beginning of April, according to the BeInCrypto page.
Siren (SIREN)
On March 23, Siren was briefly trading at $2.44 after surging 163% in just two days from its bottom on March 21. Its record high of $4.72 is still about 90% above the current position, and the projected measured move on the chart also points to that area.
Read also: Meme Coin DOGE, SHIB, and PEPE Price Prediction If Bitcoin Floats at $70K Level!
However, the CMF indicator registered at -0.10 and has been in the negative zone since March 20, even throughout the rally. In other words, the price of this meme coin continues to print new highs, but the fund flow is not picking up. This divergence is what characterizes the movement of this asset.
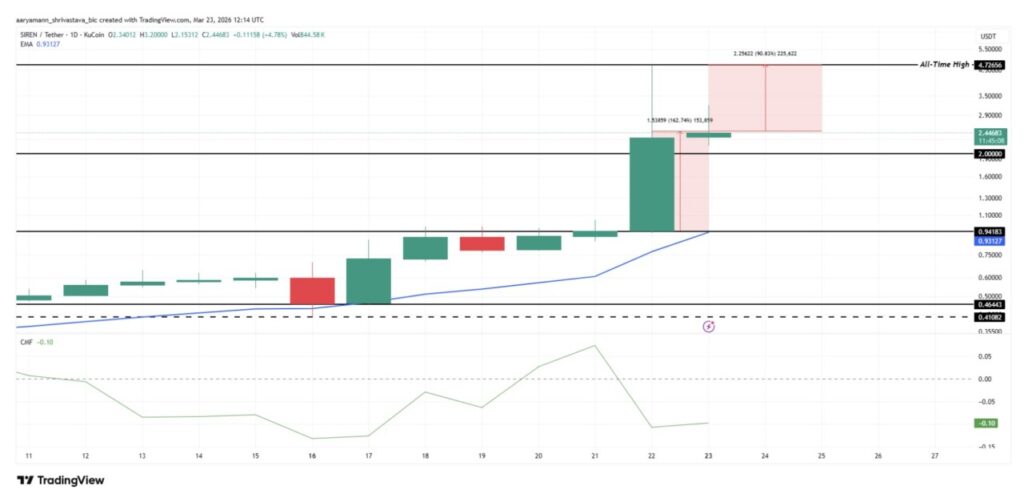
A negative CMF amidst a very rapid price spike generally indicates that market participants are taking advantage of the rise to make a gradual distribution or sell. This means that volume has not really confirmed the price strengthening.
The distribution area seen on the chart from March 22-25 puts the current price right in the high-risk zone. In case of a reversal, the $2.00 level and the EMA at $0.93 are the main support areas to watch.
Memecore (M)
On March 23, 2026, MemeCore was trading at $1,711, still up 1.57% and consolidating just below the 0.786 Fibonacci level of $1,852. This area is the upper limit of the measured move zone formed after the breakout on March 18.
The price of this meme coin has also broken back through the EMA at $1,613, which now acts as dynamic support and continues to rise.
Meanwhile, the MFI indicator stands at 58.67, still classified as neutral but pointing up without showing an overbought condition. Since it has not touched the overbought area at 80, there is still room for buying pressure to increase before the indicator signals a weakening of momentum.
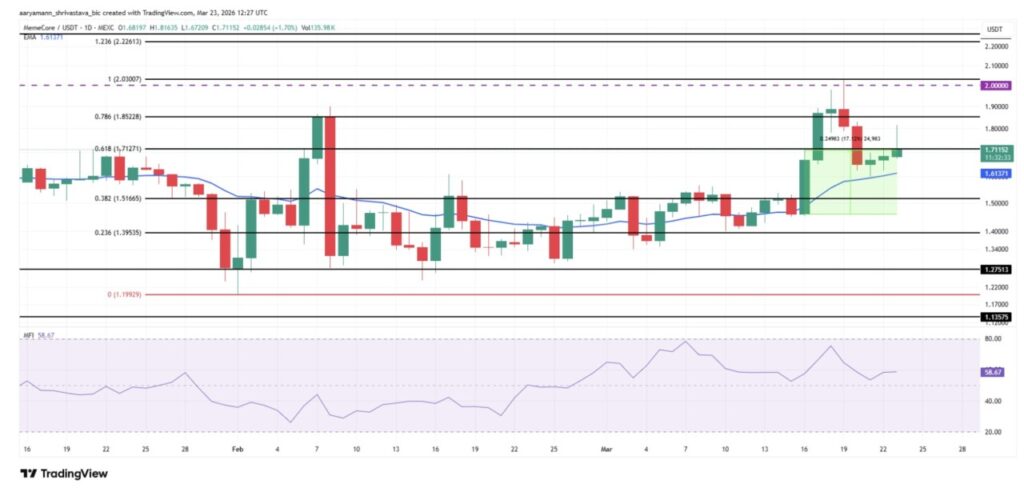
In the short term, the level to watch is the daily close above $1,712. If broken, the price will cross the 0.618 Fibonacci level and open up opportunities towards the 1.0 Fibonacci extension at $2.030, and then continue to the 1.236 Fibonacci extension at $2.226. On the other hand, the EMA at $1,613 is an important limit for the bullish camp.
If the price closes below this area, the potential for a drop to the 0.382 Fibonacci level of $1,516 is again open.
Read also: 2 Altcoins Worth Monitoring: XRP and XLM Surge, Derivative Data Reinforces Bullish Signal
OFFICIAL TRUMP (TRUMP)
On March 23, 2026, Official Trump was trading at $3,254, up 1.88%. However, the On-Balance Volume (OBV) indicator had actually peaked around March 13-14, and then continued to decline from around -$120 million to -$148.96 million. The drop in OBV when prices recovered suggests that volume reflects distribution rather than accumulation.
The first downward move of 21.15% from the March 13 peak has already occurred, taking the price from $4.04 to the 0.382 Fibonacci level of $3.39. After that, there was a second projected measured move of -15.23% that led to $2,705, the all-time low area marked in red on the chart.
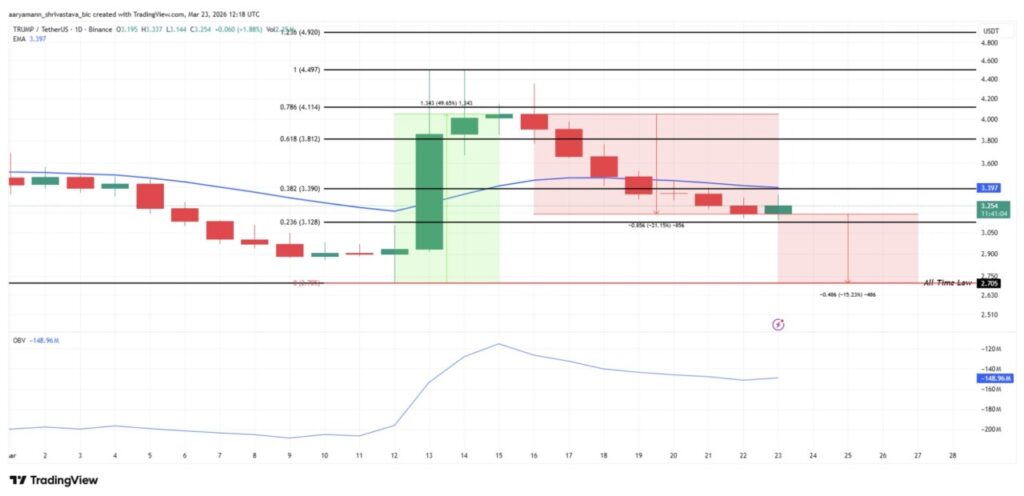
Currently, the EMA at $3,397 is above the price and serves as additional resistance. For this weakening pattern to stop, TRUMP needs to break the EMA and close daily trading above $3.39 again. Otherwise, the weakening OBV trend and the still bearish measured move structure indicate the possibility of a new low before the end of the month.
Follow us on Google News to stay up to date with the latest in crypto and blockchain technology. Check Bitcoin price, usdt to idr and tokenized nvidia stock price through Pintu Market.
As a safe crypto app, Pintu provides a crypto trading experience to access crypto gold investment easily and conveniently. You can also see today’ s gold jewelry price and today’s gold bullion price to support your investment activities and portfolio diversification as well as learn crypto through Pintu Academy.
Download the Pintu crypto app via Play Store or App Store now. Enjoy web trading experience with advanced trading tools such as pro charting, various types of order types, and portfolio tracker only at Pintu Pro.
*Disclaimer
This content aims to enrich readers’ information. Pintu collects this information from various relevant sources and is not influenced by outside parties. Note that an asset’s past performance does not determine its projected future performance. Crypto trading activities are subject to high risk and volatility, always do your own research and use cold hard cash before investing. All activities of buying and selling Bitcoin and other crypto asset investments are the responsibility of the reader.
Reference:
- BeInCrypto. 3 Meme Coins To Watch In The Final Week Of March 2026. Accessed on March 27, 2026


