Bitcoin Price Stable at $70,000 Today: What is Needed for BTC to Breakout?

Jakarta, Pintu News – Bitcoin price has begun to stabilize around $70,000 after a sharp correction, with indications that selling pressure is easing and ETF fund flows are improving. Although the short-term downward pressure has slowed down, the price recovery so far has yet to show truly convincing strength.
Spot trading volumes still tend to be low, while supply pressure in the upper area still limits the room for price increases. This puts BTC in a familiar situation-it’s starting to stabilize, but has yet to enter a clear breakout phase. The next movement will largely depend on whether new demand starts to come in, or if the price remains stuck in a wider range.
The following on-chain data from Glassnode indicates that the breakout opportunity may not happen anytime soon.
Bitcoin Price Up 0.11% in 24 Hours
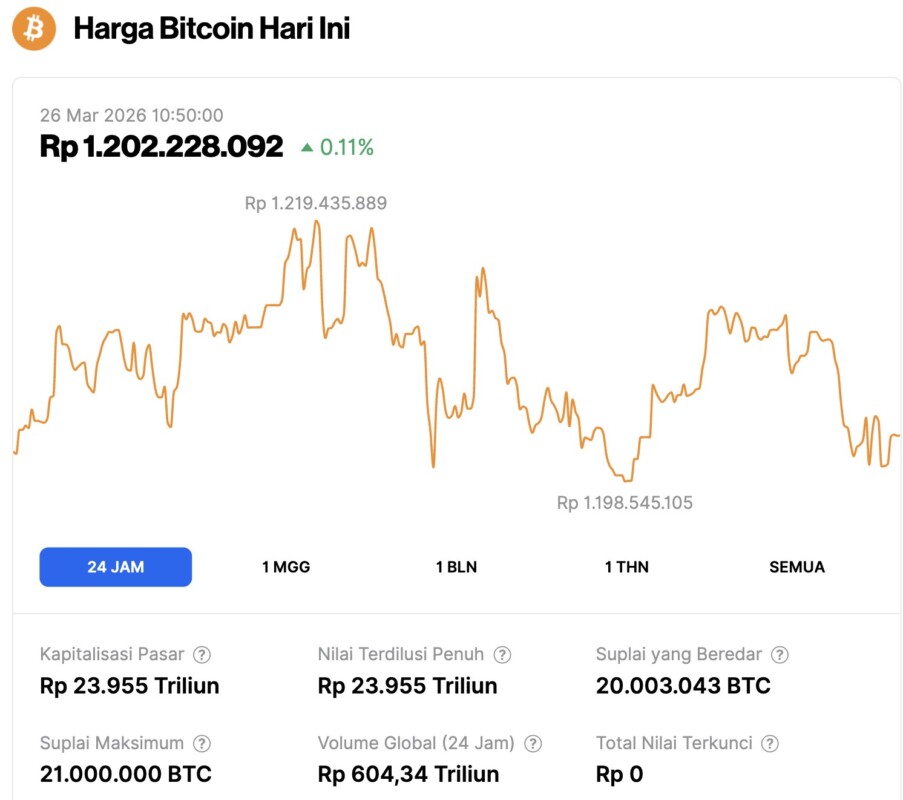
As of March 26, 2026, Bitcoin was trading at $70,793, or around IDR 1,202,228,092, marking a modest 0.11% gain over the past 24 hours. During that period, BTC fell to a low of IDR 1,198,545,105 before climbing to a daily high of IDR 1,219,435,889.
At the time of writing, Bitcoin’s market capitalization stood at approximately IDR 23,955 trillion, while its 24-hour trading volume declined 13% to IDR 604.34 trillion.
Read also: Bitcoin is Ready for Volatility, Here are 4 US Economic Data to Watch!
Short-Term Holder Cost Base Shows Pressure from the Upper Area
This heatmap shows the areas of accumulation of Bitcoin by short-term holders, so it can be used to see the concentration of supply at various price levels. Currently, a sizable portion of supply remains above the current market price, especially in the $75K-$90K range. This forms a clear resistance zone in the upper area.
Many holders in that range are still at a loss, so when prices rise, they tend to offload assets as they break even. This makes price increases slow and difficult to sustain.
On the other hand, the $65-$70K area started to form as a support cluster. This zone became an entry area for new buyers who are still holding their positions, thus temporarily resisting further downward pressure. Thus, the structure looks quite clear-Bitcoin is currently moving between a strong support foundation below and huge supply pressure above.
As long as the supply at the upper area has not been absorbed or removed, any rally is likely to face resistance, so the price remains in a consolidation phase.
Spike in Unrealized Loss Indicates Weak Hands Are Getting Eliminated
This chart tracks how large a portion of the market is at a loss over time. Currently, unrealized losses have started to increase again, which means that more and more market participants are holding Bitcoin below their purchase price.
This kind of situation generally occurs during a correction, when newly-entering buyers start to get trapped at the upper levels.
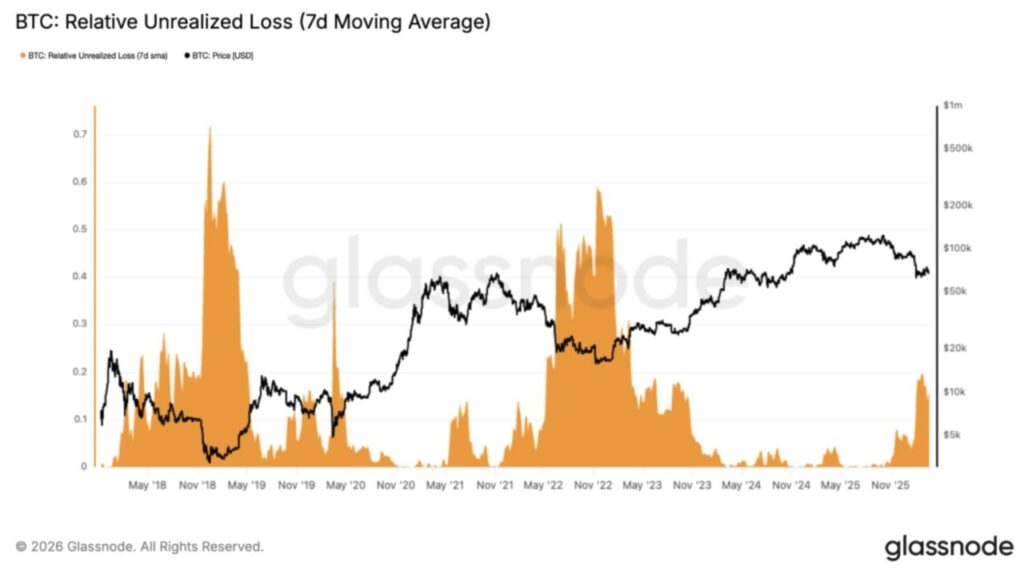
In previous cycles, sharp spikes in this metric often marked the capitulation phase, when weak hands exited the market and strong hands started accumulating. However, the current level is still more moderate than those extreme phases.
The current trading setup shows that pressure is indeed building, but not yet strong enough to signal a full market reset. This partly explains the current price movement. Bitcoin is indeed stabilizing, but without a big flush or aggressive accumulation, its momentum still remains limited.
Read also: Gold Price Forecast for 2026: Peter Schiff Expects a Rally to $11,400 After the Recent Plunge
Funding Rate Turns Negative as Sentiment Weakens
Funding rates of perpetual contracts have now reversed into negative territory across exchanges, indicating that short positions are beginning to dominate the market. This shift reflects the weakening sentiment as well as the lack of impetus to open long positions aggressively.
Previously, a positive funding rate signaled the dominance of long positions during the uptrend. However, a change to negative funding signals that market confidence has declined and market participants are no longer aggressively pursuing price increases.
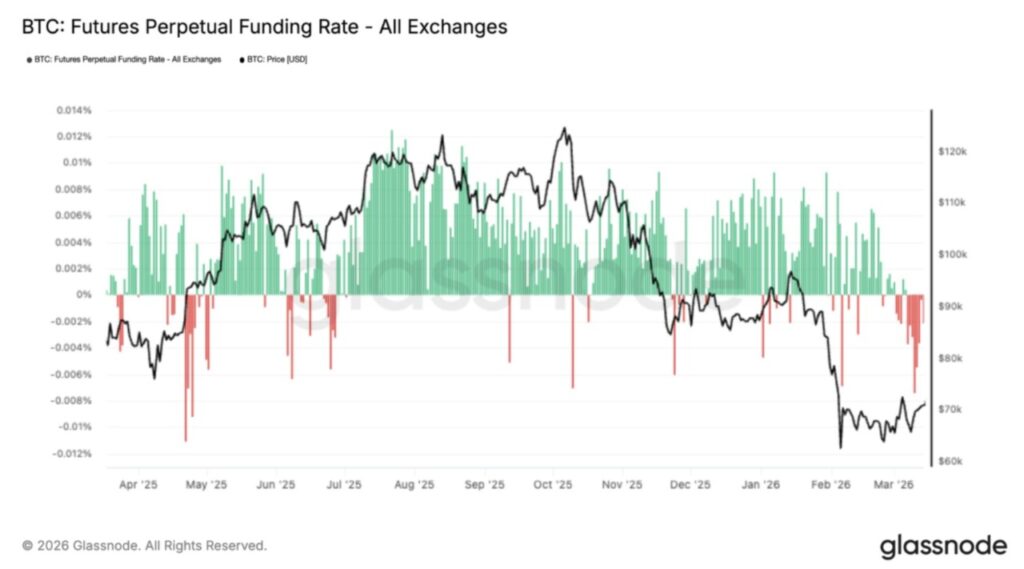
At the same time, long-lasting negative funding can also be the basis for a short squeeze, but only if demand from the spot market returns. Without such support, this further confirms the bearish pressure.
As such, the situation is quite clear-market sentiment has turned more cautious, but short positions are also starting to look increasingly congested. This leaves Bitcoin still moving within a certain range for now, while opening up the opportunity for a sharp move if sentiment suddenly reverses.
Option Gamma Shows Strong Resistance Above Current Price
Options data shows a sizable negative gamma exposure in the range of $70K-$75K, indicating strong hedging pressure from dealers. This creates resistance as prices move up and increases volatility around important levels. When gamma is in the negative region, price movements usually become more sensitive and easily magnified.
In an upside scenario, this triggers resistance as dealers tend to hedge by selling when a rally occurs. Meanwhile, in a downside scenario, selling pressure may further accelerate price weakness.
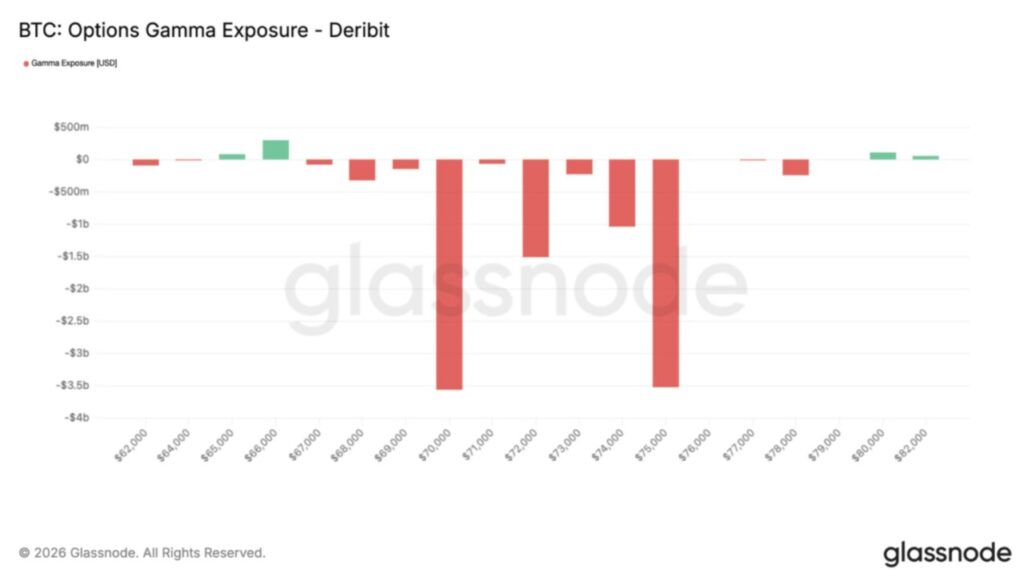
In simple terms, even if BTC tries to move higher, the existing derivative positions could potentially hold it back unless there is strong demand from the spot market to absorb it.
The current price range is still heavily influenced by positioning in the derivatives market, making breakouts more difficult in the short term. As long as this gamma pressure has not subsided or been absorbed by the market, Bitcoin is likely to remain volatile, but remain contained in a range pattern around these levels.
What Can BTC Expect until the End of the Quarter?
Bitcoin is not currently in a breakdown phase, but it cannot be said to be entering a confirmed recovery either. The market is clearly still waiting for a new influx of liquidity.
Support is starting to form in the $65-$70K area. Resistance is still quite strong in the upper range, especially around $70K-$75K. Market sentiment tends to be weak, but has not yet reached extreme levels.
For the rest of the quarter, BTC will most likely remain sideways within the same range unless a strong demand catalyst emerges. A breakout above the resistance area requires consistent spot inflows, while failure to maintain support could open up further downside opportunities.
For now, Bitcoin price is in a transitional phase-not a bearish collapse, but also not yet entering a bullish expansion phase.
Follow us on Google News to stay up to date with the latest in crypto and blockchain technology. Check Bitcoin price, usdt to idr and tokenized nvidia stock price through Pintu Market.
As a safe crypto app, Pintu provides a crypto trading experience to access crypto gold investment easily and conveniently. You can also see today’ s gold jewelry price and today’s gold bullion price to support your investment activities and portfolio diversification as well as learn crypto through Pintu Academy.
Download the Pintu crypto app via Play Store or App Store now. Enjoy web trading experience with advanced trading tools such as pro charting, various types of order types, and portfolio tracker only at Pintu Pro.
*Disclaimer
This content aims to enrich readers’ information. Pintu collects this information from various relevant sources and is not influenced by outside parties. Note that an asset’s past performance does not determine its projected future performance. Crypto trading activities are subject to high risk and volatility, always do your own research and use cold hard cash before investing. All activities of buying and selling Bitcoin and other crypto asset investments are the responsibility of the reader.
Reference:
- Coinpedia. Bitcoin Stabilizes Around $70K – What Will It Take for the BTC Price to Break Out? Accessed on March 26, 2026


