Ethereum Holds Above $2,000 as ETH Tests the 50-Day EMA

Jakarta, Pintu News – Ethereum rose more than 1% on April 1, starting the new month on a positive note. The rise came after ETH managed to end a six-month downward trend.
Throughout March, ETH posted an average gain of around 7%, although financial markets throughout the month came under pressure from the war between Israel, the US, and Iran. The largest altcoin had previously posted consecutive declines from September to February. In contrast, a number of major stock and commodity indices closed the month in the negative zone.
Then, how is Ethereum’s current price movement?
Ethereum Price Drops 2.10% in 24 Hours
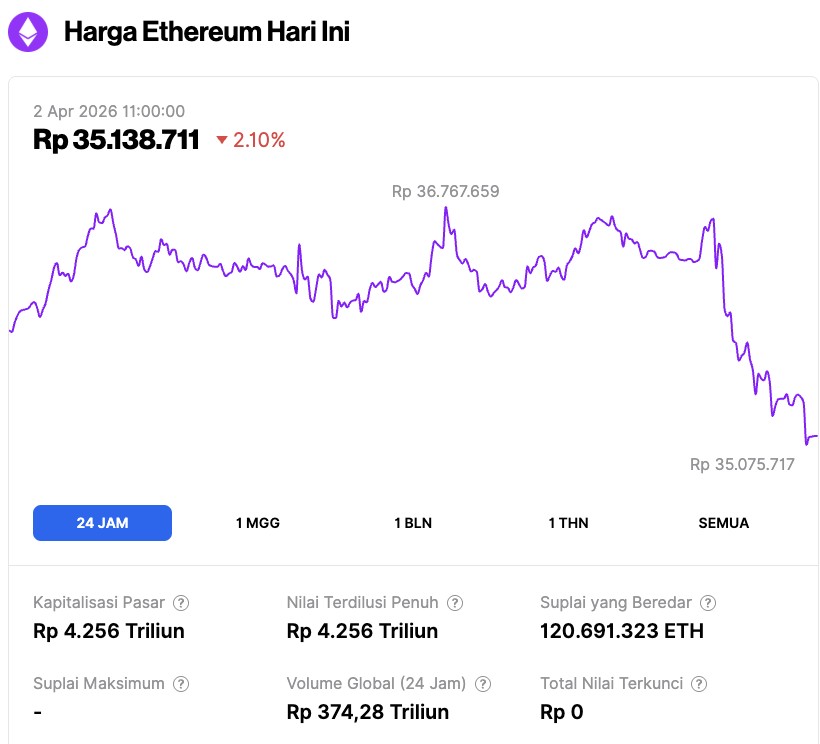
As of April 2, 2026, Ethereum was trading at around $2,054, or approximately IDR 35,138,711, down 2.10% over the past 24 hours. During that period, ETH fell to a low of IDR 35,075,717 and climbed as high as IDR 36,767,659.
At the time of writing, Ethereum’s market capitalization stood at roughly IDR 4,256 trillion, while its daily trading volume rose 10% to IDR 374.28 trillion over the last 24 hours.
Read also: Bitcoin Falls to $66,000 as Surge in Realized Losses Signals Capitulation
Ethereum Accumulation Address Records Major Activity in March
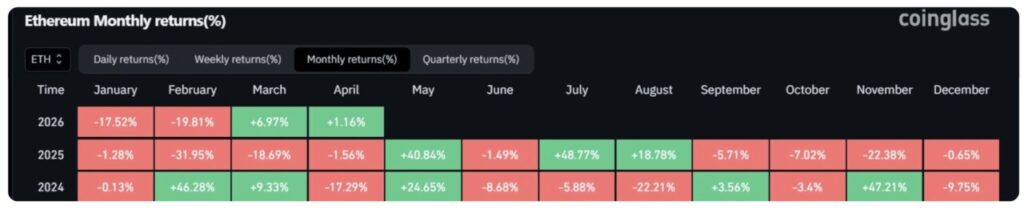
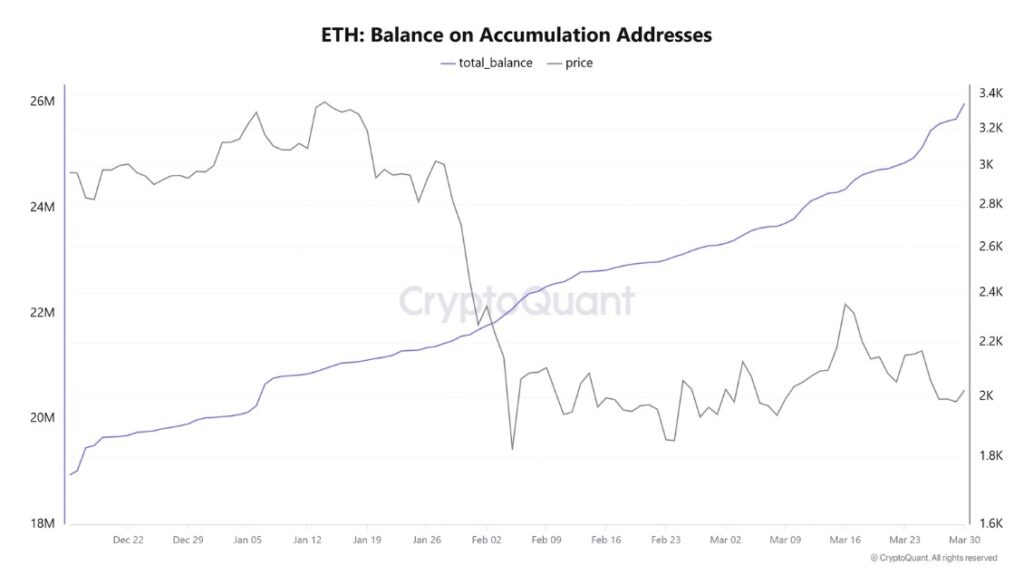
In March, ETH accumulation addresses – wallets with no sales history – were particularly active, accumulating around 2.7 million ETH. This was the largest monthly increase in over a year.
One of the main drivers of this surge has been Ethereum treasury company BitMine Immersion Technologies (BMNR). The company has been consistently buying ETH amidst weak prices, while BitMine’s Chairman, Thomas Lee, has also been making projections regarding the end of the recent crypto winter.
In his statement on the CNBC Closing Bell program on Monday, Lee said that he would buy the market at current price levels, judging that the sell-off phase is about 90-95% complete. Previously, Lee had also predicted that ETH would post positive returns and reach its price bottom in March.
However, these views are not free from criticism. Some observers consider that the BitMine Chairman has repeatedly delivered bullish predictions in recent months. Therefore, the accuracy of his predictions this time cannot necessarily be taken as proof that all his projections are always correct.
Currently, BitMine holds the largest corporate Ethereum treasury with total holdings worth 4.73 million ETH. Of this, approximately 3.14 million ETH has been allocated to staking contracts.
Read also: As 40% of Altcoins Approach Their Lowest Levels, These 22 Tokens Still Show Strength!
Ethereum Price Outlook: ETH Tests 50-Day EMA
Ethereum recorded liquidations of $57.4 million on April 1, with short positions dominating at $41.16 million, based on Coinglass data. On the daily chart, ETH is trading at $2,130. In the short term, the bias is still moderately bullish as the price remains above the 20-day Exponential Moving Average (EMA) around $2,085, while showing stabilization after the latest correction.
Meanwhile, the 50-day EMA around $2,160 still restricts the immediate upside space and becomes an important boundary in the emerging recovery phase, below the 100-day EMA which is still declining around $2,400.
The Relative Strength Index (RSI) at 54 indicates a tendency to the buy side without signaling an overbought condition. On the other hand, the Stochastic Oscillator (Stoch) bounced from the oversold area indicating that the upward momentum started to improve after last week’s weakness.
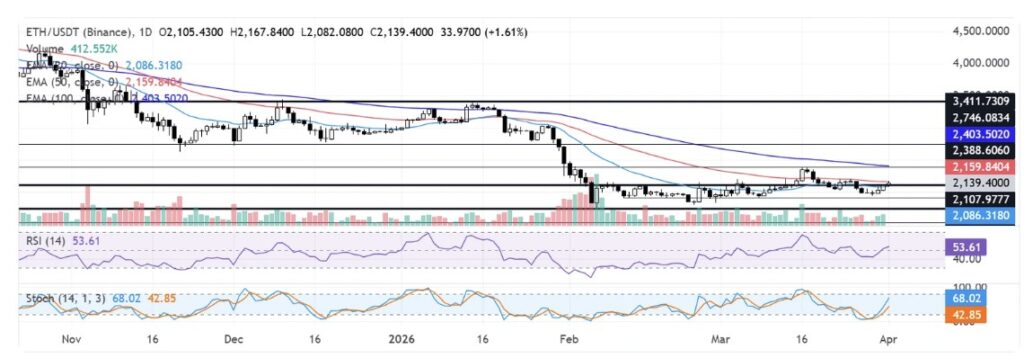
The nearest resistance level is at $2,388, which is the area where the horizontal supply meets the broader set of EMAs above the price. If ETH is able to close daily above this level, an upside opportunity towards $2,746 will open up first, and then continue to $3,412.
On the downside, initial support is at $2,108, which guards the 20-day EMA area as well as the latest swing region. If this level is broken downwards, then the price has the potential to weaken towards $1,911 and then $1,741 as the next foothold area.
If the selling pressure deepens, the next downside target is at $1,524 before reaching the key support at $1,405, an area that is expected to be an important defense zone for buyers to keep the larger bullish structure.
Follow us on Google News to stay up to date with the latest in crypto and blockchain technology. Check Bitcoin price, usdt to idr and tokenized nvidia stock price via Pintu Market.
As a safe crypto app, Pintu provides a crypto trading experience to access crypto gold investment easily and conveniently. You can also see today’ s gold jewelry price and today’s gold bullion price to support your investment activities and portfolio diversification as well as learn crypto through Pintu Academy.
Download the Pintu crypto app via Play Store or App Store now. Enjoy the web trading experience with various advanced trading tools such as pro charting, various types of order types, and portfolio tracker only at Pintu Pro.
*Disclaimer
This content aims to enrich readers’ information. Pintu collects this information from various relevant sources and is not influenced by outside parties. Note that an asset’s past performance does not determine its projected future performance. Crypto trading activities are subject to high risk and volatility, always do your own research and use cold hard cash before investing. All activities of buying and selling Bitcoin and other crypto asset investments are the responsibility of the reader.
Reference:
- FX Street. Ethereum Price Forecast: ETH ends six-month loss streak with 7% gain in March, is the bottom in? Accessed on April 2, 2026