These 4 Charts Indicate Ethereum (ETH) May Be in the Peak Pain Phase This Cycle

Jakarta, Pintu News – The price of Ethereum has corrected about 60% from its peak in 2025. As a result of the decline, long-term holders are now only slightly above breakeven, while the average market participant is still recording losses.
However, underneath the pressure, historical patterns are again signaling something familiar – this kind of condition often appears at the bottom phase of the price. Today, four important metrics of on-chain data and market sentiment converged in one moment, forming one of the most crucial Ethereum setups in over a year.
Here’s what the data actually shows, as well as the implications for the direction of ETH price movement going forward.
Long-Term Holders Still Under Pressure
Let’s start with the most important metric, which is long-term holders (LTH). Net Unrealized Profit/Loss (NUPL) for long-term ETH holders indicates the aggregate profitability level of wallets that have held assets for a long period of time.
Read also: Ethereum (ETH) Headed to $4,000 in 2026? Check out the Full Prediction and Analysis!
This graph depicts a pretty tough condition. Based on Glassnode data, ETH’s NUPL LTH peaked in the green or “optimism” zone at around 0.65 in the period from July to September 2025. That phase coincided with the price of Ethereum trading near the peak of its cycle, which was above $4,900.
After that, the value continues to decline through the yellow area or “hope” zone, and then drops sharply in February 2026. Currently, the LTH NUPL is in the orange area, around 0.05 to 0.15, or just slightly above zero.
This condition is very important to note. When NUPL LTH is close to zero, it means that long-term holders are on the verge of a losing position. However, as they begin to approach breakeven or even enter into loss territory, the market has generally passed most of the downward pressure.
Historically, orange zones often mark the formation of a price bottom, or at least the final phase before a price bottom is actually reached.
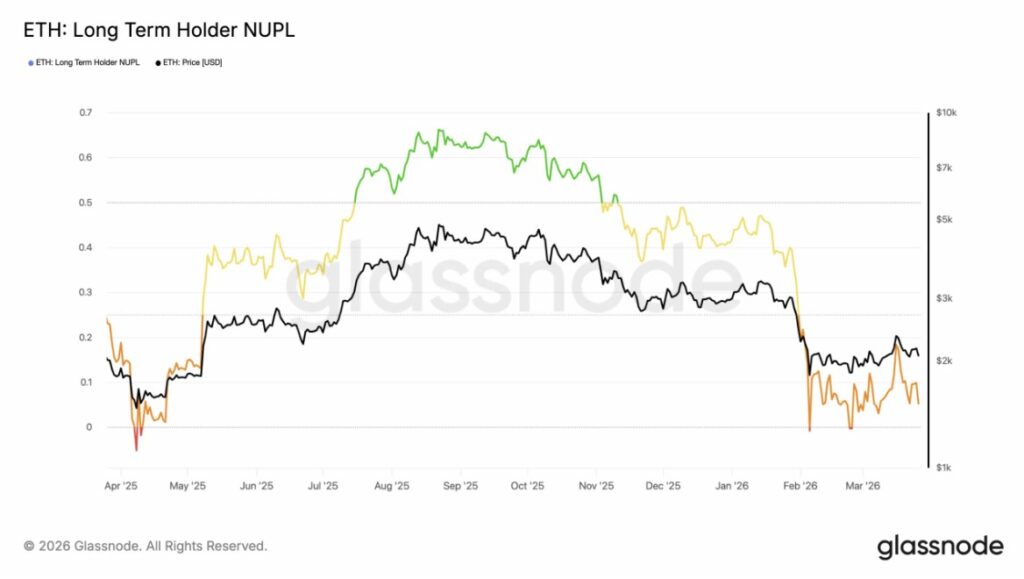
There were two brief moments when this metric went into the red zone, when LTHs were in a net loss position, in early April 2025 and again in February 2026.
Both periods coincided with price lows. Therefore, if the historical pattern repeats itself, it’s possible that the Ethereum price has hit its cyclical bottom.
ETH Traded at the Basic Price Level
Beyond that, Ethereum’s realized price chart also provides signals that appear less frequently, but are much stronger. Realized price is the average price at which each coin last changed hands on-chain. Currently, that metric is in the range of $2,000 to $2,100.
Meanwhile, the spot price of ETH is trading at around $2,044. This means that ETH is basically moving around its aggregate base price. In other words, the overall market is at breakeven.
If you look at the chart in a broader perspective, the confluence of the spot price and realized price like this has only happened a few times throughout Ethereum’s history.
In the 2018 bear market, the price fell through the realized price and stayed below that level for months. In 2022, the Ethereum price fell below the realized price in June and only recovered more than a year later.
Both periods were stressful, but at the same time they were also the deepest accumulation phases in each cycle. The most important question now is whether ETH will be able to stay above the realized price, or break back down.
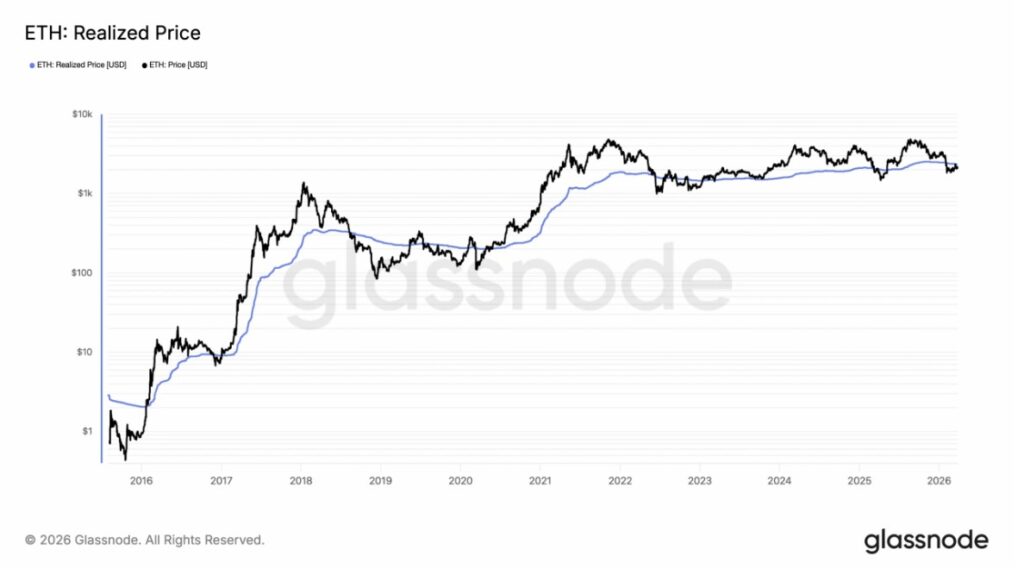
If the ETH price stays above $2,000, it indicates that the market is forming a bottom area. Conversely, if the price drops below that level, the average asset holder will enter into a losing position. Historically, this situation is rare, but it often signals an important market capitulation.
Average Holder Still in Loss Position
In addition, Santiment’s MVRV (Market Value to Realized Value) chart reinforces this signal with a higher degree of urgency.
Currently, the MVRV is at -11.33%. This means that the metric is still in the negative zone. In other words, the average ETH holder still bears an unrealized loss of more than 11%.
Read also: 3 XRP Signals Quietly Bought: Price of IDR 22,000 Can Explode?
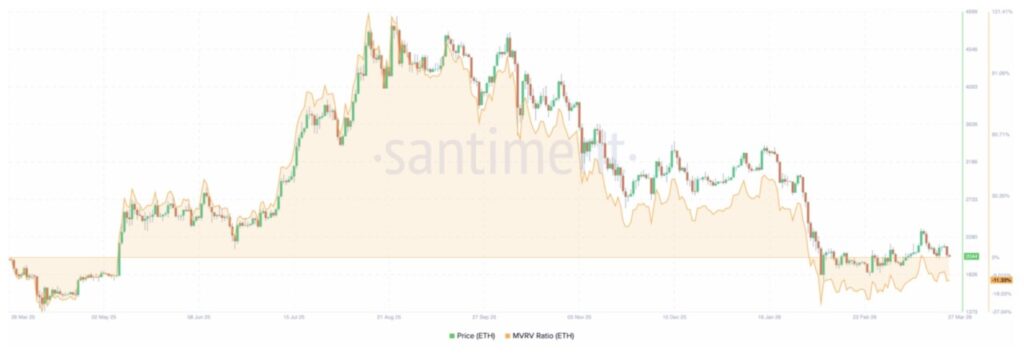
At the peak of the cycle in the July to August 2025 period, the MVRV briefly broke the 90% level. Since then, there has been a full and very sharp reversal. The MVRV even dropped to -27% in February 2026, before recovering slightly.
Historically, negative MVRV readings have been rare and almost always associated with large market bottoms forming.
In previous cycles, sustained ETH recoveries generally started shortly after the MVRV went into the negative zone and then back out of that area. The current level of -11.33% suggests that the market is still under pressure, but the worst phase of the negative extremes has likely begun to pass.
In terms of price, this is a two-way signal. On the one hand, a strongly negative MVRV reduces selling pressure from above as most holders are no longer in a position to “secure” profits.
On the other hand, if the MVRV stays in the negative area for too long, market confidence could continue to weaken and any meaningful price recovery could potentially be delayed.
Asian Retailers Already Out of the Market
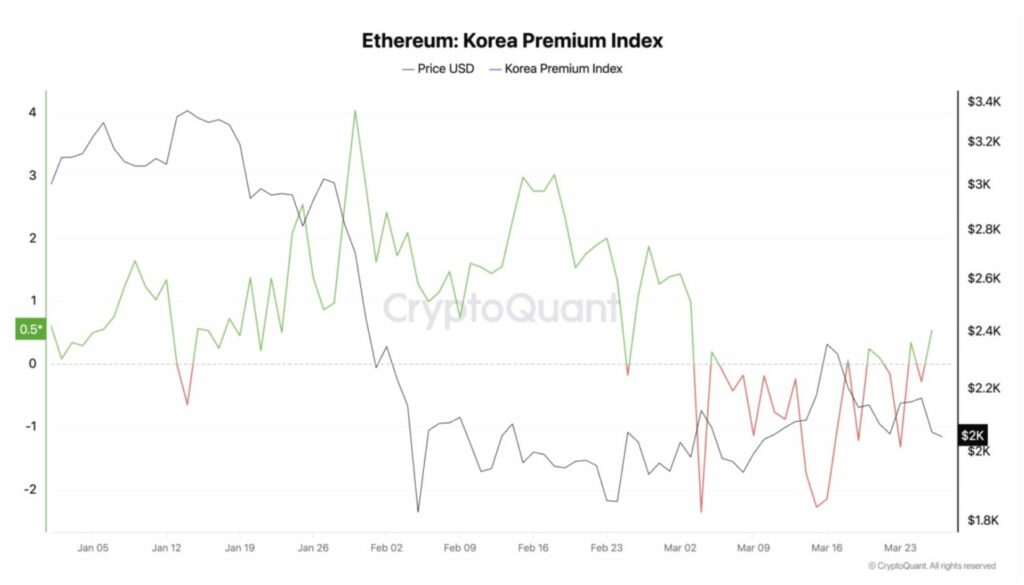
The Korea Premium Index is the most difficult sentiment factor to predict, and it’s quite worrisome for short-term price movements.
As of early January 2026, the Korea Premium is still in the healthy range of around +3 to +4. This shows that Korean traders are willing to pay more than the global price to own ETH. This generally reflected retail euphoria or FOMO. However, the situation then changed drastically.
Towards the end of January, the index fell into a deep negative zone to touch -2.5. After a brief bounce, the index fell sharply again in mid-to-late February. Until the end of March 2026, the value still moved in the range of -1 to -2, which means it remained in the negative area.
A negative Korea Premium is quite an important bearish signal. Korean retail investors are known to be one of the most reactive and sentiment-driven groups of crypto market participants.
When they sell ETH at a discount to the global market, it reflects fear, not greed. It also indicates that there is no new surge in demand from that market in the near future.
This is one metric that makes the bullish reversal narrative not entirely smooth.
While on-chain data strongly signals that the market is forming a bottom, the recovery still needs buyers. At the moment, one of the most active retail markets in the crypto industry has not shown any buying interest, but is still in the discounting phase.
Conclusion for ETH Price
If all four charts are read together, the picture that emerges is quite consistent. Ethereum’s on-chain metrics are currently in deep capitulation territory: The NUPL of long-term holders is close to zero.
The spot price has also approached the realized price, while the MVRV is still in the negative area. In previous cycles, this combination of conditions has often appeared before a significant price recovery.
However, the Korea Premium Index presents reasons to remain cautious. On the demand side, the market still looks weak. There has been no retail euphoria to drive renewed buying pressure.
Therefore, if a recovery does occur from current levels, it will most likely not be an explosive process. Instead, the recovery could be slow, gradual, and highly dependent on macro and fundamental catalysts that are able to revive market interest.
For long-term investors focused on accumulation, this data suggests that the current phase is historically one of the more attractive risk/reward windows in the current cycle. However, for short-term traders, the absence of demand from Korean retail is a signal not to be too quick to expect a breakout in the near future.
ETH at $2,000 doesn’t mean it’s broken. ETH is simply in a pressure phase. Whether that pressure will recover quickly or slowly depends entirely on the next development, but the price floor area is looking stronger by the day.
Follow us on Google News to stay up to date with the latest in crypto and blockchain technology. Check Bitcoin price, usdt to idr and tokenized nvidia stock price through Pintu Market.
As a safe crypto app, Pintu provides a crypto trading experience to access crypto gold investment easily and conveniently. You can also see today’ s gold jewelry price and today’s gold bullion price to support your investment activities and portfolio diversification as well as learn crypto through Pintu Academy.
Download the Pintu crypto app via Play Store or App Store now. Enjoy web trading experience with advanced trading tools such as pro charting, various types of order types, and portfolio tracker only at Pintu Pro.
*Disclaimer
This content aims to enrich readers’ information. Pintu collects this information from various relevant sources and is not influenced by outside parties. Note that an asset’s past performance does not determine its projected future performance. Crypto trading activities are subject to high risk and volatility, always do your own research and use cold hard cash before investing. All activities of buying and selling Bitcoin and other crypto asset investments are the responsibility of the reader.
Reference:
- CCN. These 4 Charts Suggest That Ethereum (ETH) Price Has Hit Peak Pain This Cycle. Accessed on April 2, 2026