Bitcoin Touches $70,000 Today as Bullish Signal Sparks Move Toward $78,000

Jakarta, Pintu News – Bitcoin price was briefly at $71,552 after forming a bullish continuation pattern on the daily chart (8/4), indicating a potential increase of 11% if a breakout occurs.
The US CPI report for March released on Friday is expected to show inflation rising to 3.3% on an annualized basis. However, the roughly 1,300% surge in weekly Bitcoin ETF inflows as well as rising asset outflows from exchanges suggest that demand for BTC could potentially cushion the pressure from the macro sentiment.
Then, how is the current Bitcoin price movement?
Bitcoin Price Drops 0.35% in 24 Hours
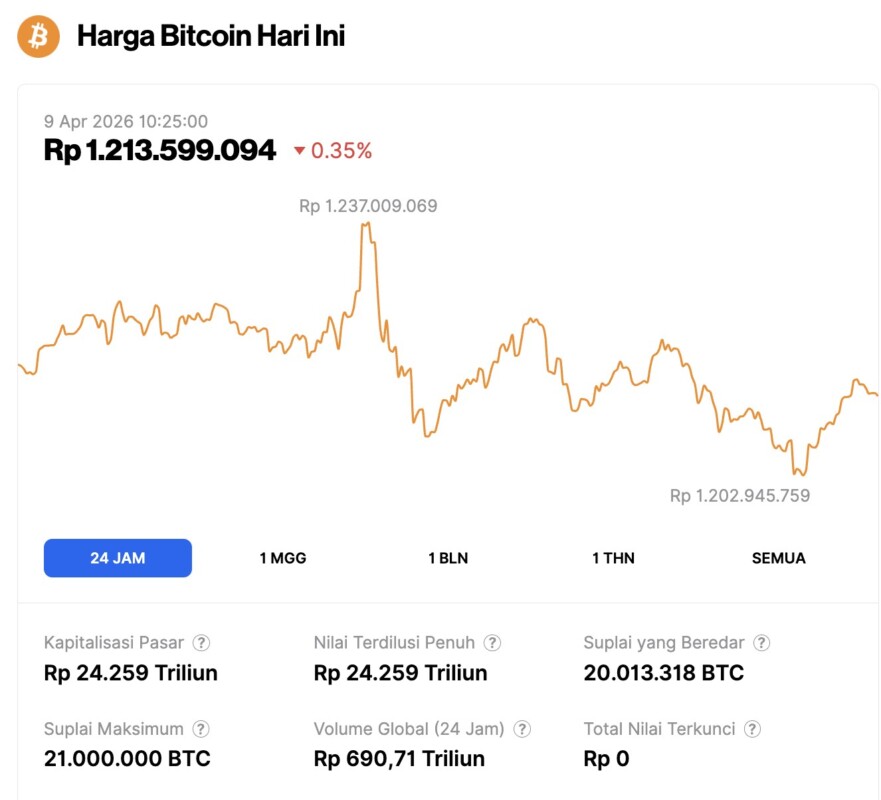
As of April 9, 2026, Bitcoin was trading at $70,902, or around IDR 1,213,599,094, after slipping 0.35% over the past 24 hours. During that period, BTC fell to a low of IDR 1,202,945,759 and climbed as high as IDR 1,237,009,069.
At the time of writing, Bitcoin’s market capitalization stood at approximately IDR 24,259 trillion, while its 24-hour trading volume dropped 15% to IDR 690.71 trillion.
Read also: XRP Remains Trapped Below $2, but Is This Capitulation or an Early Reversal Signal?
Bitcoin Price Forms Bullish Pattern as Weekly ETF Inflows Surge
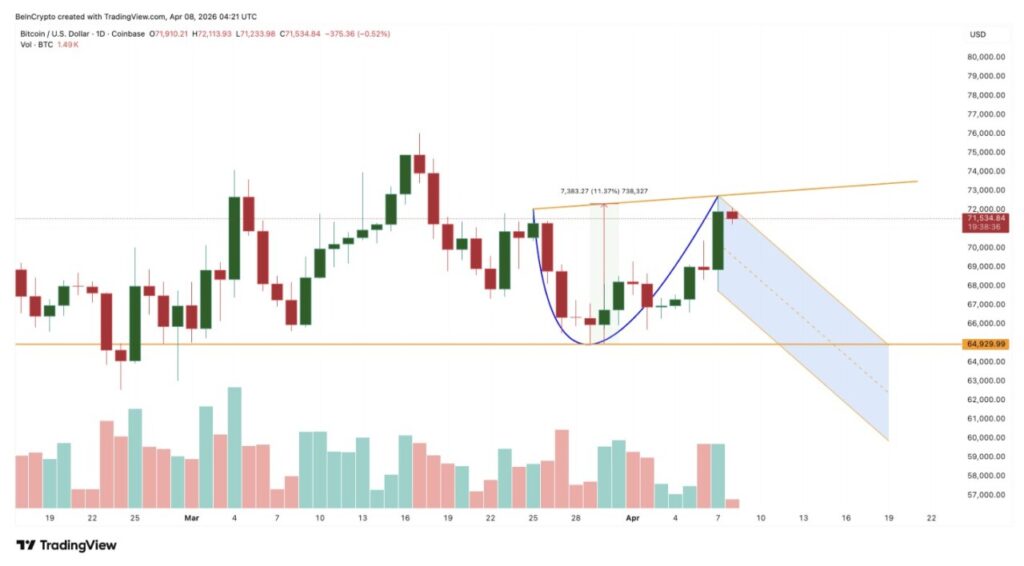
In the period from late March to April 7, Bitcoin price formed a cup and handle pattern on the daily chart. This pattern is known as a bullish continuation pattern, where a curved recovery phase forms a “cup”, followed by a mild correction that forms a “handle”, before potentially breaking upwards.
The bottom of the cup began to form during the correction at the end of March, while the price weakness after the April 7 peak reflects the handle phase. If this pattern is confirmed, the upside potential is estimated at 11%.
The volume movement also supports the formation of the pattern. The selling pressure during the handle phase is noticeably lower than the buying volume that previously drove the rise during the cup phase. The decrease in volume when the handle forms is a common characteristic of this pattern and indicates that the pressure from sellers is weakening, rather than strengthening.
On the institutional side, positive sentiment is also increasingly evident. Weekly inflows into Bitcoin ETFs rose sharply from $22.34 million in the week ending April 2 to $312.27 million in the week ending April 7. This increase equates to about 1,300%.
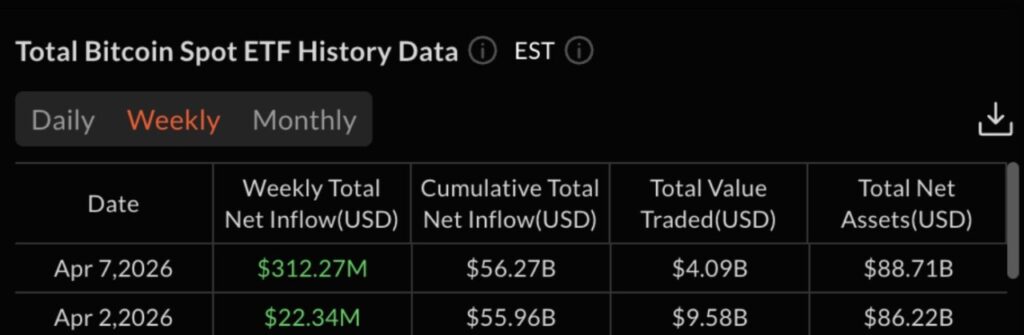
The surge comes as Morgan Stanley plans to list its spot Bitcoin ETF, MSBT, on April 8, with an expense ratio of 0.14%, which is one of the lowest among all spot BTC funds.
Even so, ETF inflows alone are not enough to ensure that spot market participants have the same level of confidence in Bitcoin’s upward trajectory.
Exchange Outflows Grow as Spot Buyers Continue to Accumulate
Demand in the spot market also strengthened as inflows into ETFs increased. This can be seen from the exchange net position change, an indicator that measures the inflow and outflow of Bitcoin from exchanges. Its value fell deeper from -30,727 BTC on April 6 to -37,472 BTC on April 7.
Read also: Solana Presents STRIDE and Incident Network to Enhance Security
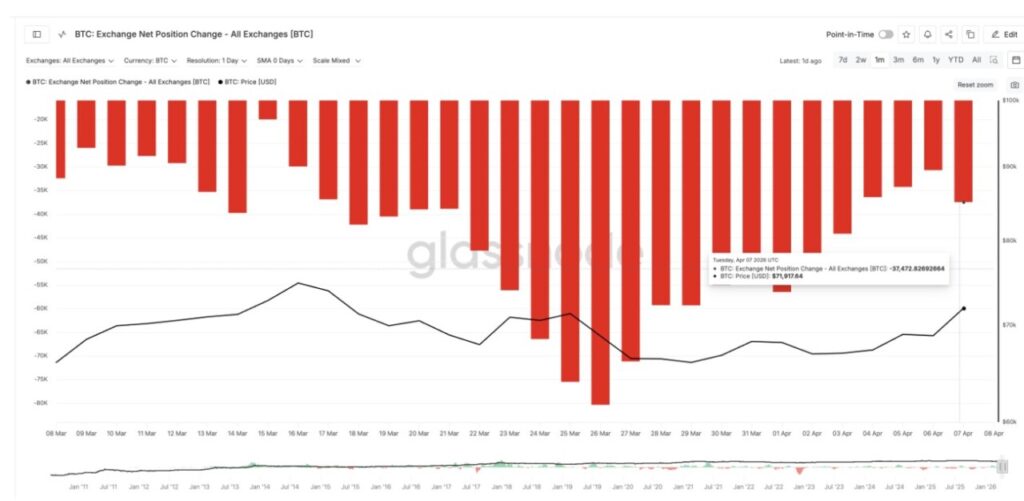
This negative number indicates that more Bitcoin is leaving the exchange than entering. A 22% increase in the intensity of outflows in a single day indicates that holders may be getting more aggressive in moving BTC into storage.
The reduced supply of Bitcoin on exchanges makes the liquidity available on the spot market tighter. As ETF inflows increase while Bitcoin balances on exchanges continue to decline, the chances of an accelerated price increase also tend to increase. This combination suggests that the ongoing rally is underpinned by real demand, not solely by leverage-based speculation.
With institutional fund flows and spot demand now both favoring BTC’s gains, price action will be the deciding factor as to whether these signals actually prompt a breakout or if they lose momentum.
Bitcoin Price Levels to Watch Ahead of Friday’s CPI Release
The neckline of the cup and handle pattern is at $73,238 and is in line with the 0.618 Fibonacci level. Historically, this area is often the completion point of proportional corrections from previous movements. If Bitcoin price is able to close daily above this level, the pattern will be confirmed and open up opportunities for a measured increase towards $78,383, or about 7% above the neckline.
Meanwhile, the full projection of this pattern points to a higher upside potential of around 11%.
Before breaking the neckline, Bitcoin price first needs to convincingly reclaim the $71,649 area located at the 0.5 Fibonacci level. Closing above this level will signal that the handle phase is complete.
The cup and handle pattern that appears after a sharp recovery has one important caveat. The handle must remain above the midpoint of the cup depth for the pattern to remain valid. Currently, the handle is still quite far above that midpoint, so the bullish structure is still maintained.
Friday’s CPI data release opens up two possibilities. If BTC continues to rally despite the high inflation data recorded at 3.3%, it will strengthen the narrative that Bitcoin is starting to be seen as a hedge against inflation.
Conversely, if the data triggers selling pressure, the correction is still likely to stay within the handle range without breaking the overall pattern, especially since there is still support from ETF fund flows and accumulation in the spot market as seen earlier.
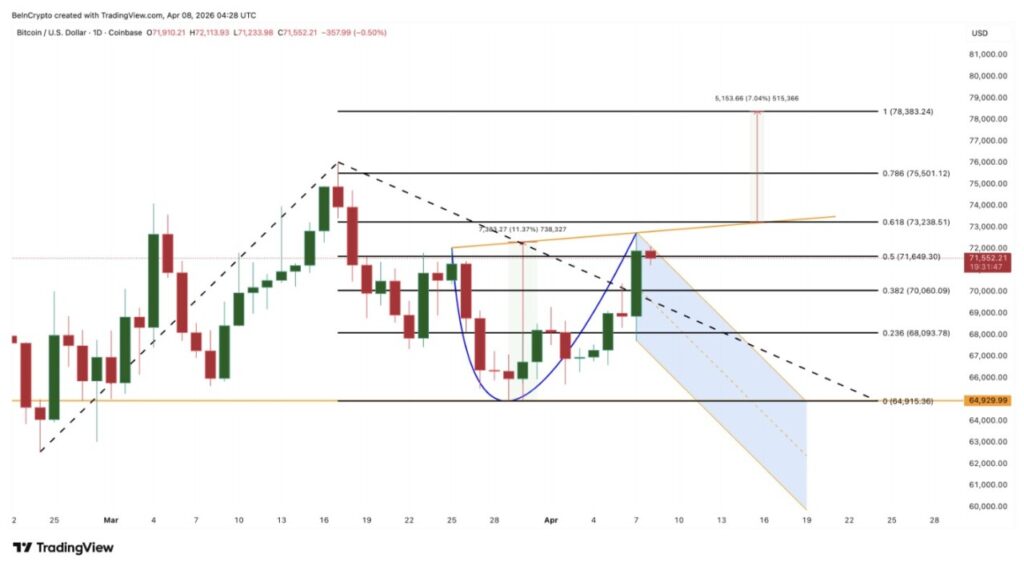
On the downside, the $70,060 area at the 0.382 Fibonacci level is the first support for Bitcoin. If the price drops below $68,093, the handle structure will start to weaken significantly. Meanwhile, a drop below $64,915, which is the bottom of the cup, will invalidate this pattern completely.
For now, the level of $73.238 is the main boundary separating the chance of a confirmed breakout towards $78.383 from the possibility of the price dropping back into the handle area and retesting the level of $68.093.
Follow us on Google News to stay up to date with the latest in crypto and blockchain technology. Check Bitcoin price, usdt to idr and tokenized nvidia stock price via Pintu Market.
As a safe crypto app, Pintu provides a crypto trading experience to access crypto gold investment easily and conveniently. You can also see today’ s gold jewelry price and today’s gold bullion price to support your investment activities and portfolio diversification as well as learn crypto through Pintu Academy.
Download the Pintu crypto app via Play Store or App Store now. Enjoy the web trading experience with various advanced trading tools such as pro charting, various types of order types, and portfolio tracker only at Pintu Pro.
*Disclaimer
This content aims to enrich readers’ information. Pintu collects this information from various relevant sources and is not influenced by outside parties. Note that an asset’s past performance does not determine its projected future performance. Crypto trading activities are subject to high risk and volatility, always do your own research and use cold hard cash before investing. All activities of buying and selling Bitcoin and other crypto asset investments are the responsibility of the reader.
Reference:
- BeInCrypto. Bitcoin Chart Pattern Targets $78,000 – Key Levels to Watch. Accessed on April 9, 2026