Bitcoin, Ethereum, & XRP Surge $99 Billion in a Week—What’s Next After US Inflation Data Shock?

Jakarta, Pintu News – Following signs of easing inflation in the latest US CPI and PPI reports, investors are now turning their attention to key developments that could impact the prices of Bitcoin , Ethereum , and Ripple in the coming week.
Bitcoin, Ethereum, and Ripple Rally as US CPI and PPI Spark $99 Billion Surge
According to Coingape (3/15/25), Bitcoin (BTC), Ethereum (ETH), and Ripple (XRP) recorded modest gains this week, driven by bullish factors that offset concerns due to trade tensions between the US, Canada, and Mexico.
Read also: Can Pi Network Price Reach $10 with Elon Musk Parody Account Support?
The publication of positive CPI and PPI data, indicating inflation is starting to ease, has boosted investor confidence.
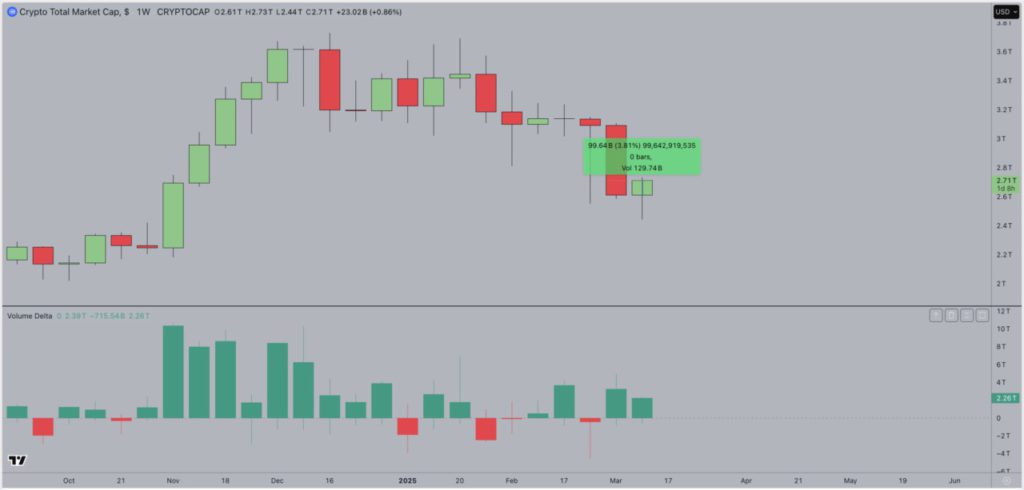
Following the latest inflation report from the US, the global market capitalization of cryptocurrencies surged by $99.7 billion in the past week, reaching $2.71 trillion on March 15, 2025.
This positive sentiment encouraged capital inflows into the crypto market, which contributed to the recent surge in market capitalization.
Here are some important developments that are expected to have a significant impact on the prices of major crypto assets such as BTC, ETH, and XRP in the coming week:
Bitcoin Price Prediction: BTC Could Soar to $90,000 if MicroStrategy Reinvests
On March 15, 2025, the price of Bitcoin (BTC) briefly traded at $84,312, up 0.39% on the day, as it attempted to break a key resistance level amid speculation that MicroStrategy (now Strategy) might go ahead with its BTC acquisition.
Recent price movements show BTC trying to break through the 50-day moving average, which has been a dynamic resistance in the downward trend.
The Bollinger Bands indicator shows a narrowing, which signals decreased volatility-often the first sign before a breakout.
Currently, BTC is trading near the lower boundary of the Bollinger Band, indicating limited downside risk, while the upper boundary at $93,302 is the next resistance level that needs to be broken.
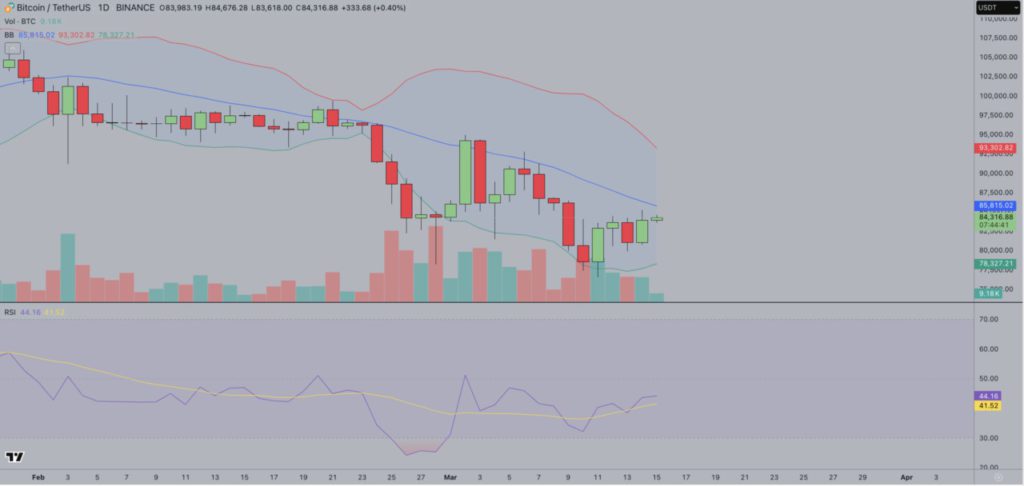
If the breakout happens, BTC could potentially head towards $90,000 or more, especially if MicroStrategy actually goes back to buying BTC.
However, the RSI indicator is still below the neutral level of 50, at 44.15, which indicates that the bullish momentum is still weak. If BTC fails to break the 50-day moving average, the price could again test the support level at $78,326.
Read also: Rumble Buys $17 Million Worth of Bitcoin, Is this the Future of Finance?
If macroeconomic conditions worsen or institutional demand weakens, the possibility of BTC dropping further to $75,000 is still open.
Ripple (XRP) Price Prediction: Altcoin ETF Progress Could Propel XRP to $3
The price of XRP surged to $2.5 on Saturday, recording a 30% gain in the last four days. The surge was driven by improved macroeconomic sentiment as well as renewed optimism regarding settlement talks between the SEC and Ripple.
Recent reports indicate that the SEC may consider classifying XRP as a commodity, further boosting investor confidence.
Technically, XRP remains in a bullish trend after successfully reclaiming important levels. This latest rally was supported by strong volume inflows, confirming the sustainability of the uptrend.
The Parabolic SAR indicator shows its dots have moved below the price action, signaling a trend reversal to the upside, which also aligns with the “Buy” signal on the chart. In addition, the 200-day moving average (blue line) continues to serve as dynamic support, preventing a deeper correction.
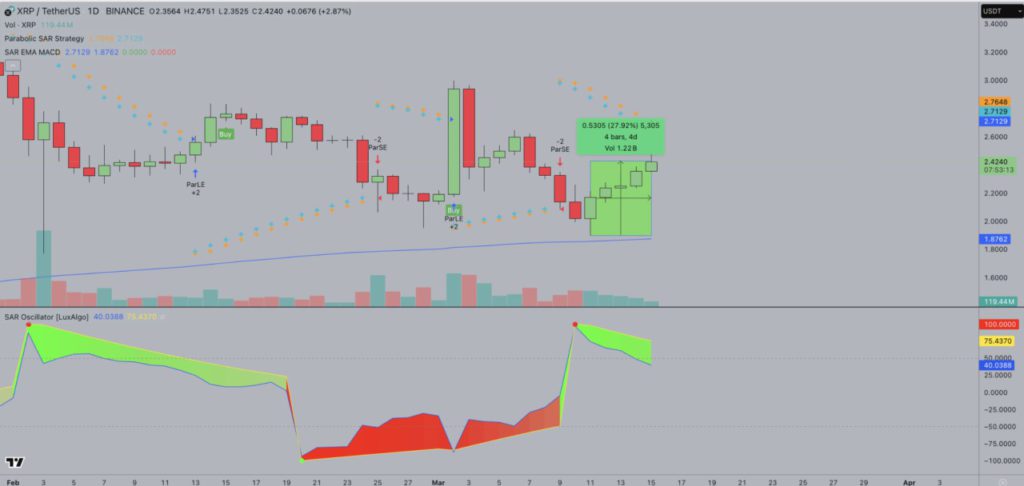
In terms of oscillators, the SAR Oscillator has shifted sharply into the green zone, confirming an increase in bullish momentum. At 75.43, this indicator shows that XRP is starting to approach overbought conditions, but still has room for further upside.
If the rally continues, XRP could break the psychological level of $3, especially if optimism regarding ETFs persists.
However, if XRP fails to hold above $2.50, a short-term correction to $2.20 could occur, which may be an entry point for new buyers. If the overall crypto market sentiment weakens, the possibility of prices dropping to the 200-day moving average around $1.87 also remains.
For now, XRP remains in a strong position for further gains, with ETF speculation and regulatory clarity as key catalysts in a potential prolonged rally.
Read also: Ripple (XRP) Officially Receives License in Dubai! Ready to Revolutionize Crypto Payment Services?
Fed’s Rate Hike Pause Could Drive Increased Demand for Ethereum (ETH)
Among the major crypto assets, Ethereum (ETH) has struggled to gain momentum in recent weeks, facing bearish pressure due to network update delays and controversy over leadership changes at the Ethereum Foundation.
However, improvements in the broader macroeconomic landscape could potentially trigger higher demand for ETH.
The Federal Reserve’s (Fed) monetary policy is likely to be more dovish this week, despite controversies related to the US trade war with Canada and Mexico. Following the release of the US CPI and PPI reports, analyst Miles Deutscher mentioned that the market is now pricing in three rate cuts by the Fed by 2025.
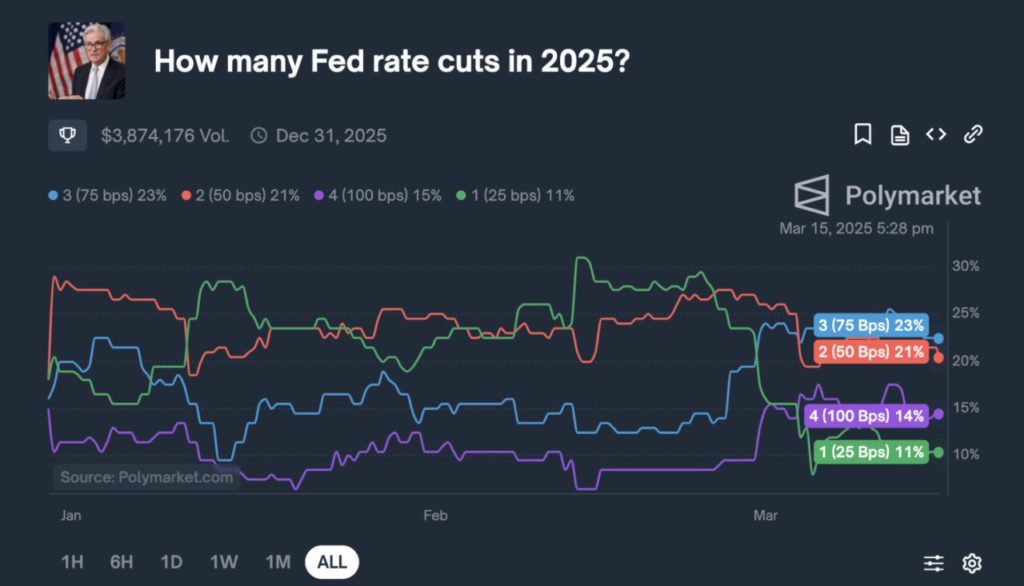
Prediction data from Polymarket also supports this view, with current bets showing a 23% probability of three rate cuts this year.
With the next Federal Open Market Committee (FOMC) meeting scheduled for March 19, traders are watching for signals that could further strengthen expectations of monetary easing.
Prediction data from Polymarket indicates that most crypto investors now project that the Fed will maintain current interest rates.
If this is confirmed, a more dovish Fed policy could increase liquidity in financial markets, which has historically benefited riskier assets like crypto.
In this scenario, Ethereum could experience increased demand from both institutional and retail investors, as lower interest rates typically encourage capital inflows into ETH as well as high-yielding DeFi protocols operating on the Ethereum network.
Ethereum Price Prediction: $2,330 Resistance Level Could Cap Further Gains
According to Coingape’s report, the Ethereum (ETH) price prediction chart shows signs of a potential recovery, but resistance around $2,330 could limit the upside in the near term.
As of March 15, the daily chart shows that ETH is struggling to break the middle level of the Donchian Channel, which currently stands at $2,297, with an upper limit at $2,839. The ongoing downtrend indicates that if the bullish momentum fails to strengthen, ETH could again test the lower boundary at $1,754.
Also read: 5 Crypto Recommended to Sell Ahead of FOMC Meeting
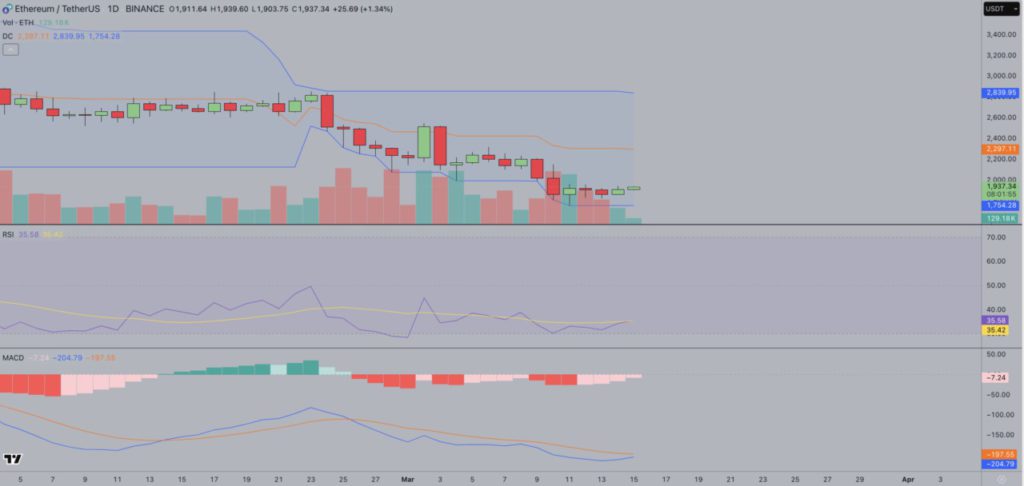
The Relative Strength Index (RSI) indicator is at 35.57, signaling that ETH is still in an oversold state, but has yet to show a strong trend reversal.
Historically, an RSI below 40 indicates bearish dominance, but if ETH is able to hold above 40, momentum could turn in favor of the bulls.
Meanwhile, the MACD indicator is still in the negative zone, with the MACD line at -7.25 and the signal line continuing to decline, which reinforces the bearish outlook. However, if a bullish crossover occurs, this could be an early signal of a trend reversal.
If ETH manages to break the resistance at $2,297, then a push to $2,330 could pave the way for further gains towards $2,839.
Conversely, if it fails to hold above $2,000, ETH is at risk of a deeper correction, with $1,754 as an important support level if selling pressure resumes.
That’s the latest information about crypto news today. Get more information about crypto academy from beginner to expert level only at Pintu Academy and enrich your knowledge about the world of crypto and blockchain.
Follow us on Google News to get the latest information about crypto and blockchain technology. Enjoy an easy and secure crypto trading experience by downloading Pintu Crypto via Google Play Store or App Store now.
Experience web trading with advanced trading tools such as pro charting, various order types, and portfolio tracker only at Pintu Pro. Click Register Pintu if you don’t have an account or click Login Pintu if you are already registered.
*Disclaimer
This content aims to enrich readers’ information. Pintu collects this information from various relevant sources and is not influenced by outside parties. Note that an asset’s past performance does not determine its projected future performance. Crypto trading activities have high risk and volatility, always do your own research and use cold cash before investing. All activities of buying and selling bitcoin and other crypto asset investments are the responsibility of the reader.
Reference:
- Coingape. BTC, ETH, XRP Price Prediction: 3 Things to Expect as US Inflation Data Triggers $99 Billion Demand in 7 Days. Accessed March 17, 2025