Ripple (XRP) Price Getting Ready to Surge? Check out the Upside Potential!

Jakarta, Pintu News – After falling below the $2.3350 zone, the price of Ripple is now starting to recover its losses and shows indications of an increase. This price movement occurs in contrast to Bitcoin and Ethereum which tend to stabilize. Ripple (XRP) briefly touched the $2.3150 zone, marking the lowest point before attempting to rise again.
Technical Analysis: Barriers and Support
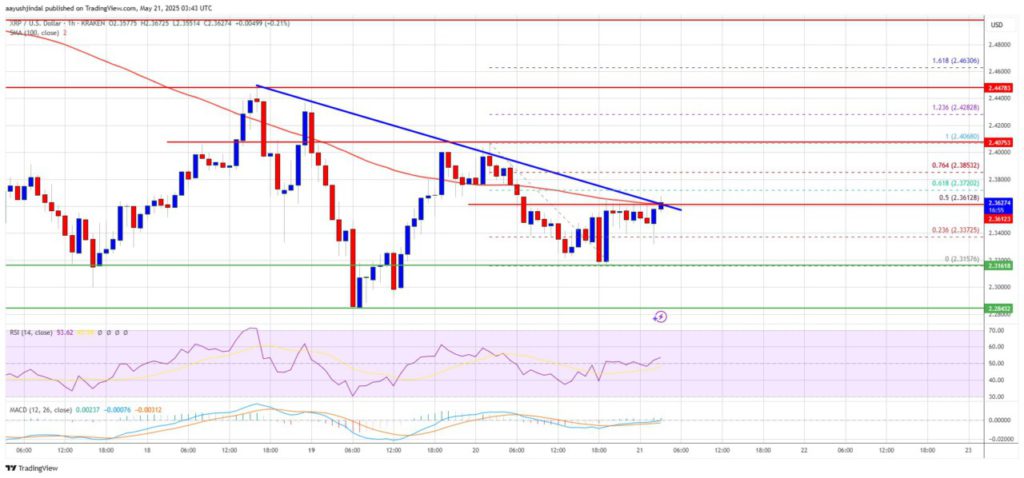
Ripple (XRP) is now facing some important hurdles that could determine the direction of its next move. There is a bearish trend line with resistance at $2.3620 formed on the hourly chart of Ripple (XRP) against the US dollar (USD). Currently, Ripple (XRP) is trading around $2.35 and the 100-hour simple moving average.
If the price can break the resistance at $2.3650, then there will be an opportunity to reach the next resistance at $2.3850. Ripple (XRP) is also testing the 76.4% Fib retracement level of the move down from $2,4068 to $2,3157. If it manages to cross $2,420, the next potential upside could be $2,450, and if this momentum continues, the price could reach $2,50 or even $2,550 in the near term. However, if Ripple (XRP) fails to break the $2,420 resistance zone, there is a possibility that the price will drop again.
Read More: Bitcoin Sets New Price Records: What Are the Implications for the Crypto Market?
Downside Potential: What Happens if it Fails to Rise?
If Ripple (XRP) does not manage to break the $2.420 resistance zone, another price drop is likely. Initial support lies near the $2.3150 zone, with the next major support near $2.30. A break below $2.30 could trigger further declines towards support at $2.220 and the next major support zone at $2.20.
Technical Indicators: MACD and RSI
The Moving Average Convergence Divergence (MACD) indicator for Ripple (XRP) against the US dollar (USD) is currently losing momentum in the bearish zone. Meanwhile, the Relative Strength Index (RSI) for Ripple (XRP) against the US dollar (USD) is above the 50 level, indicating a potential upside. However, these two indicators show that the market is still not fully stabilized and investors need to be wary of possible changes.
Closing: Conclusions and Expectations
With various clear barriers and supports, the Ripple (XRP) market is currently at a critical juncture. Success or failure in breaking through the resistance points will largely determine the price direction of Ripple (XRP) in the near future. Investors and market watchers should pay attention to technical indicators and market dynamics to make informed investment decisions.
Read More: Bitcoin and Dogecoin Set New Price Records Amid Crypto Market Trends
That’s the latest information about crypto. Follow us on Google News for the latest crypto and blockchain technology updates. Enjoy an easy and secure crypto trading experience by downloading Pintu crypto app via Google Play Store or App Store now.
Experience web trading with advanced trading tools such as pro charting, various order types, and portfolio tracker only at Pintu Pro. Pintu Pro Futures is also available, where you can buy bitcoin leverage, trade btc futures, eth futures and sol futures easily from your desktop!
*Disclaimer
This content aims to enrich readers’ information. Pintu collects this information from various relevant sources and is not influenced by outside parties. Note that an asset’s past performance does not determine its projected future performance. Crypto trading activities are subject to high risk and volatility, always do your own research and use cold hard cash before investing. All activities of buying andselling Bitcoin and other crypto asset investments are the responsibility of the reader.
Reference
- NewsBTC. XRP Price Coils for Breakout to $2.40. Accessed on May 21, 2025
- Featured Image: FinBold