Dogecoin Crashes Hard — But Could This Be the Start of a 150% Surge?

Jakarta, Pintu News – Reporting from Coin Central (4/6/25), Dogecoin price movements are showing mixed signals as this meme coin consolidates near the current support level.
Currently, the cryptocurrency is trading at $0.1896 after breaking below the $0.22 support area last week.
Dogecoin Price Drops 2.83% in 24 Hours
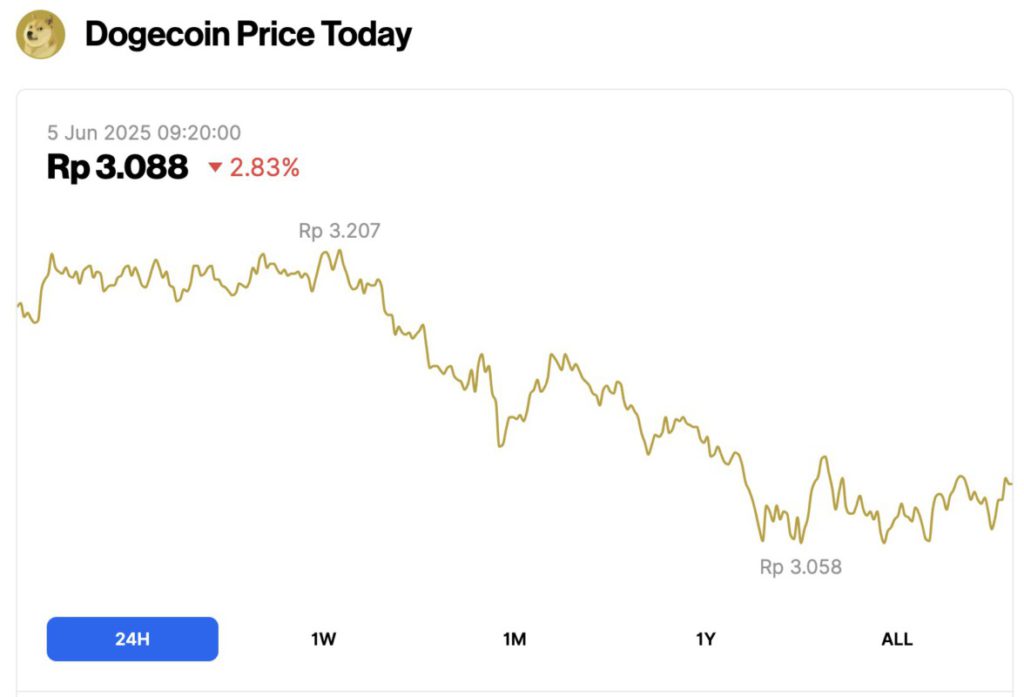
On June 5, 2025, Dogecoin saw a 2.83% drop over the past 24 hours, with its price settling at $0.1896, or approximately IDR 3,088. During the day, DOGE traded as high as IDR 3,207 and dipped as low as IDR 3,058.
At the time of writing, Dogecoin’s market cap stands at around $28.35 billion, with trading volume falling 16% to $764.84 million within 24 hours.
Read also: Ethereum Stalls at $2,600 — Are Crypto Whales Plotting a Massive ETH Breakout?
DOGE Consolidates in Narrow Trading Range
According to Coin Central’s report (4/6), DOGE’s price drop started from the $0.2250 zone, which pushed DOGE past two important levels, $0.220 and $0.20.
Selling pressure from the bearish side briefly pushed the price down to $0.1855, before buyers finally stepped in to defend the lower support area.
Despite the recent weakness, Dogecoin’s bullish side was still able to keep the price structure above the $0.18 level. The defense of this key level comes amidst the observations of technical analysts who see an important pattern forming on the monthly chart.
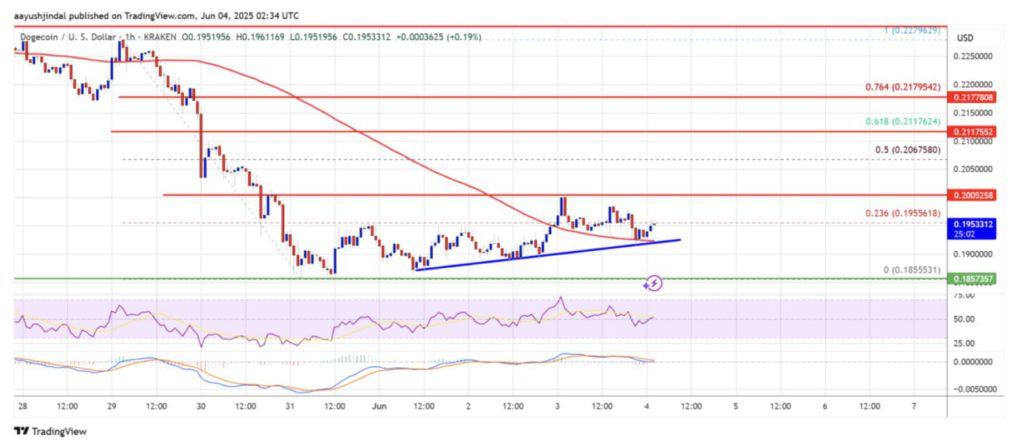
As of June 4, DOGE was consolidating within a narrow trading range, moving between resistance at $0.20 and support at $0.185 in the last 24 hours.
Technically, DOGE is trading below the $0.20 level and below the 100-hour simple moving average (SMA). There is also an uptrend line formed on the hourly chart, with support points around $0.1910.
DOGE Monthly Pattern Formation
Technical analysis revealed a rounded bottom pattern forming on the monthly chart for almost four years. This pattern started during the big price spike in 2021, which brought Dogecoin to an all-time high above $0.73.
After reaching that peak, Dogecoin entered a prolonged correction phase throughout 2022 to early 2023.
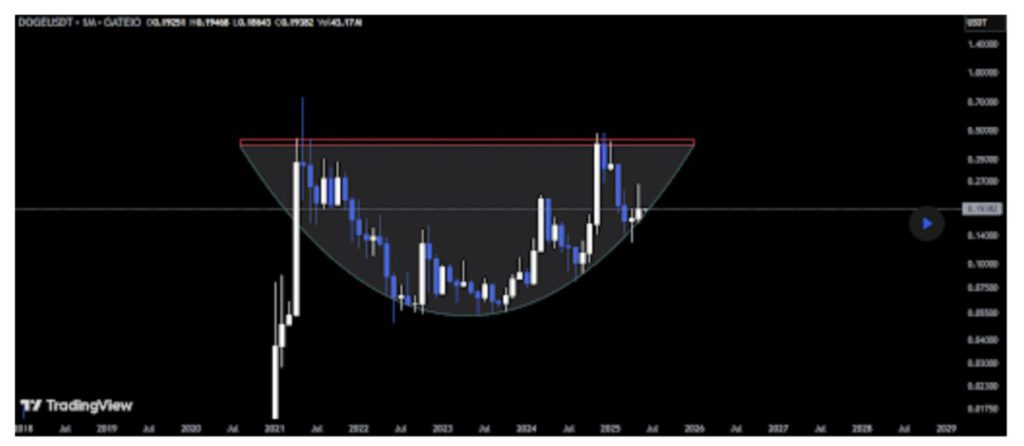
Despite the continued decline, this pattern shows higher and higher lows, forming a subtly curved bottom and now seems to be almost completed on the right side.
Read also: Can Dogecoin (DOGE) Hit a New All-Time High in 2025?
This rounded bottom pattern is known as a strong reversal pattern, generally appearing at the end of a major downtrend. Since mid-2022, every time the price touches the bottom line of this pattern, it tends to bounce back and print higher highs.
Currently, the monthly candle is again testing the base support level of the pattern. In the event of a bounce from this point, it is possible that the Dogecoin price could break the December 2024 price peak of $0.48, printing even higher levels.
Since the correction started in 2022, the bullish side has always managed to take control at every major swing low point. This consistency in maintaining support levels strengthens the technical argument that the rounded bottom pattern is on its way to completion.
Price Targets and Resistance Levels: DOGE Potentially Up 150%?
If the rounded bottom pattern structure holds, then DOGE’s upside target could potentially break above $0.50. This would represent a jump of approximately 150% from the current price.
The target zone also coincides with key resistance from December 2024, and is just below the 2021 all-time high.
If DOGE manages to break and confirm a move above $0.50, the price has the potential to continue its rally towards a new record above $0.73.
For the short term, the nearest resistance is around the $0.20 level. The first major resistance that the bullish side needs to cross is around $0.2060, which is also near the 50% Fibonacci retracement level.
The next resistance zone is at $0.2120. If the price is able to close above this level, then there is a high probability that DOGE could head towards $0.2250 resistance, and even $0.2340.
However, if DOGE fails to break above $0.20, then it is likely that selling pressure will re-emerge. Initial support on the downside lies around $0.1910, which also coincides with the trend line. Stronger support is at $0.1850.
The main support level is currently at $0.1720. If the price breaks down from this level, then there is potential for a further decline towards $0.1650 or even $0.1550 in the near term.
In terms of technical indicators, the signals are still mixed: the hourly MACD indicator shows a loss of momentum in bearish territory, while the RSI remains above the 50 level, signaling a buying impulse.
A clean monthly candle close above the May price peak ($0.27) would be an early confirmation that a potential major breakout is approaching.
That’s the latest information about crypto. Follow us on Google News to stay up-to-date on the world of crypto and blockchain technology.
Enjoy an easy and secure crypto trading experience by downloading Pintu crypto app via Google Play Store or App Store now. Get a web trading experience with advanced trading tools such as pro charting, various types of order types, and portfolio tracker only at Pintu Pro. Pintu Pro Futures is also available, where you can buy bitcoin leverage, trade btc futures, eth futures and sol futures easily from your desktop!
*Disclaimer
This content aims to enrich readers’ information. Pintu collects this information from various relevant sources and is not influenced by outside parties. Note that an asset’s past performance does not determine its projected future performance. Crypto trading activities have high risk and volatility, always do your own research and use cold cash before investing. All activities of buying and selling bitcoin and other crypto asset investments are the responsibility of the reader.
Reference:
- Coin Central. Dogecoin (DOGE) Price: Bulls Target 300% Rally as Rare Technical Pattern Emerges. Accessed on June 5, 2025


