Top 5 Crypto RWA Projects that Soar as Institutional Investor Interest Strengthens!

Jakarta, Pintu News – The top five crypto RWA projects are back in the limelight, and not quietly this time. As of March 17, 2026, institutional interest looks to be deepening into blockchain infrastructure, while pushing back the real-world assets (RWA) narrative.
The numbers are starting to look more and more convincing. From infrastructure-focused projects to high-volatility challengers, the current leaderboard shows that the sector is no longer just a theoretical concept. It is active, liquid, and the competition is fierce.
Chainlink Leads RWA’s Project Row
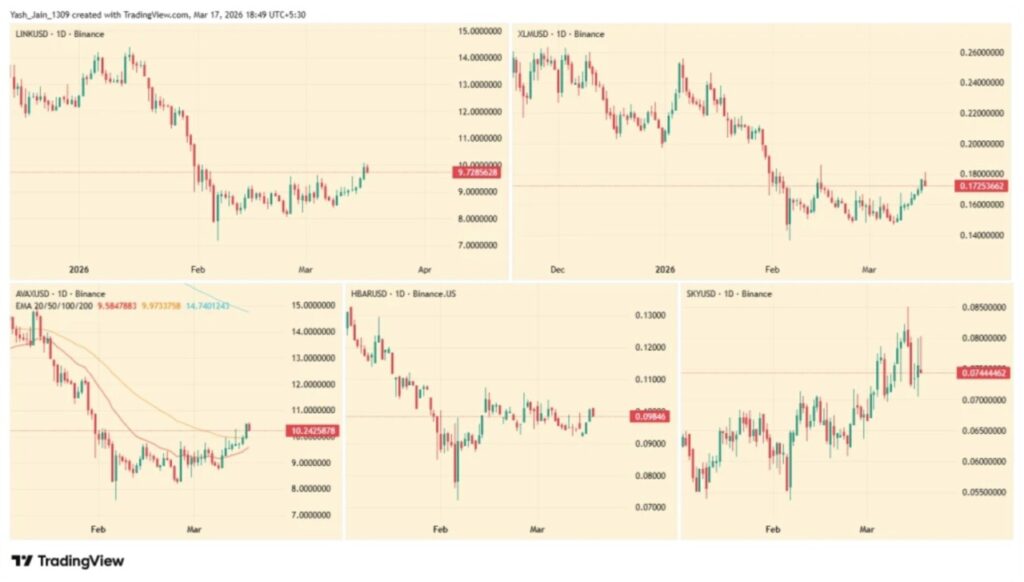
At the top spot, Chainlink is still holding on comfortably. It has a market capitalization of $6.9 billion and is trading at around $9.76, with a slight daily gain of 1.28%. It doesn’t look explosive yet, but the movement tends to be steady.
Read also: Pi Network Price Prediction After PI Mainnet Upgraded to Protocol 20!
Price-wise, Chainlink has finally managed to break out of the month-long consolidation phase that lasted throughout February. After briefly touching the lower area near $8.00, the price has now started to move up, although it has not been completely smooth. The resistance level at $10.50 is still a difficult upper limit to break.
On the other hand, the $9.00 area has now turned into a support level, and this is certainly a positive signal that the bulls want to see.
XLM’s Volume Surge Signals Strength
Right behind it, Stellar performed without much ado. With a market capitalization of $5.72 billion and a price around $0.1736, the asset is showing stronger short-term energy, especially after its 24-hour trading volume (17/3) jumped 34.44%. Activity of this magnitude usually signals that traders’ attention is on the rise.
Technically, the chart is forming a rounding bottom pattern, which generally indicates a switch from bearish pressure to an accumulation phase. However, it is still too early to be overly optimistic as the $0.1900 level remains a strong resistance, while $0.1600 still serves as a fairly solid support.
The momentum is already there. However, the continuation of its movement still needs to be proven.
AVAX Builds Momentum Silently
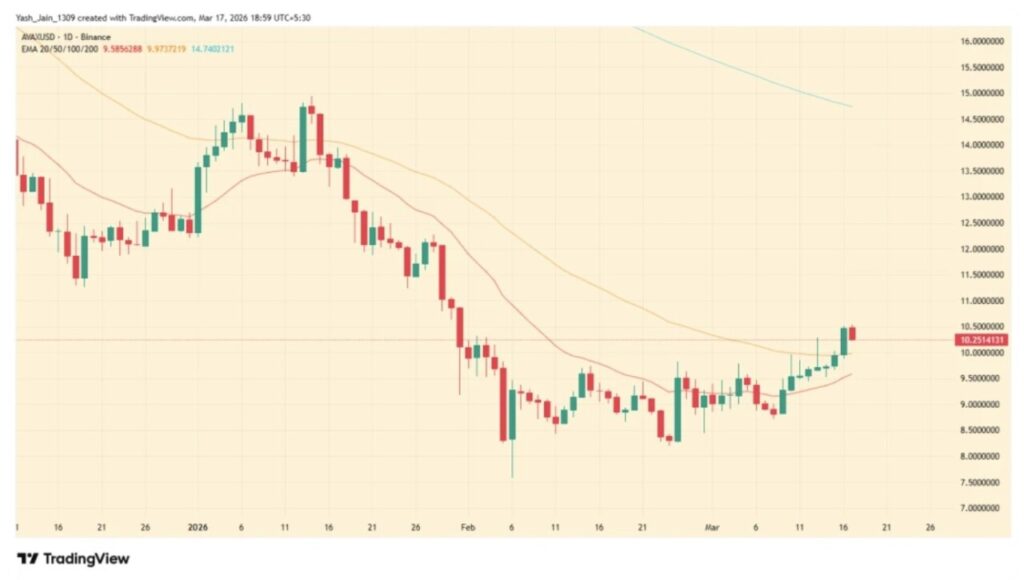
Next up is Avalanche , with a market capitalization of $4.42 billion and a price of $10.24. At first glance, a daily gain of 0.66% doesn’t seem too exciting. However, a deeper look reveals an important development: the price is attempting to reclaim its position above the 50-day EMA, while forming a bull flag pattern since mid-February.
This is usually the setup that traders look out for. The nearest resistance is at the $11.50 area, which is in line with the 100-day EMA. Meanwhile, on the downside, the $9.50 level is still an area of support. It’s not very noticeable, but it’s still structurally strong.
Read also: Pepe Coin Price Jumps 20%, How High Can PEPE Fly in March?
HBAR Moves in Consolidation Phase Ahead of Potential Breakout
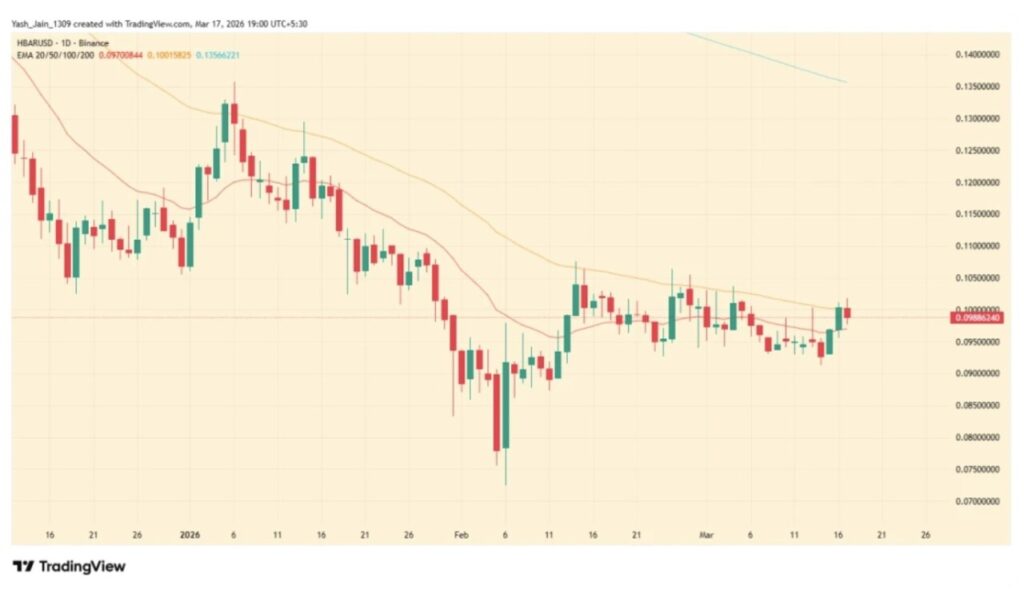
Hedera was trading at $0.0986 with a market capitalization of $4.27 billion. The price movement is still stuck in a narrowing range. This kind of pattern, often referred to as coiling, generally appears before a breakout, although the direction of movement is still uncertain.
The key level to watch is the resistance at $0.1100, which previously served as support. Meanwhile, HBAR price analysis shows that the $0.0880 area is still an important lower boundary as long as the level remains viable. For now, HBAR is still in the phase of waiting for direction confirmation.
SKY Surges with Big Volume Support
Then there is Sky , an asset that is arguably the wildcard on this list. With a smaller market capitalization of around $1.74 billion, its performance stands out in terms of pure momentum. The token is up 5.69% in the last 24 hours (3/17), supported by a massive 91.33% surge in volume.
As of March 17, Sky’s price was around $0.0756 and continues to move towards the resistance level at $0.0850. If this level is successfully broken, the movement has the potential to become much more aggressive in a positive context.
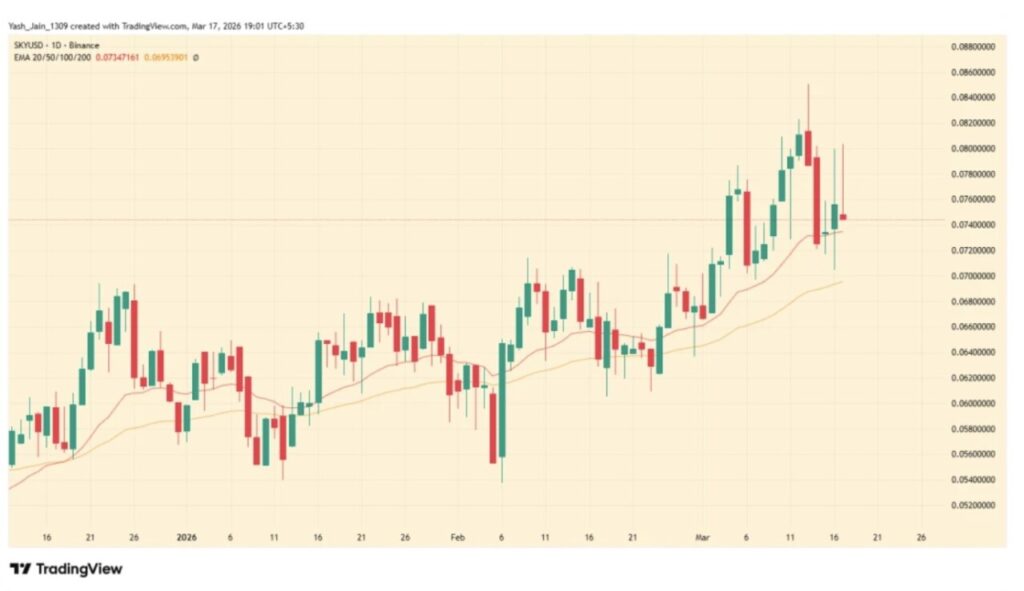
However, volatility always works in both directions. The $0.0650 area remains the main support zone, which is the level where buyers previously entered quite aggressively.
Follow us on Google News to stay up to date with the latest in crypto and blockchain technology. Check Bitcoin price, usdt to idr and tokenized nvidia stock price via Pintu Market.
As a safe crypto app, Pintu provides a crypto trading experience to access crypto gold investment easily and conveniently. You can also see today’ s gold jewelry price and today’s gold bullion price to support your investment activities and portfolio diversification as well as learn crypto through Pintu Academy.
Download the Pintu crypto app via Play Store or App Store now. Enjoy the web trading experience with various advanced trading tools such as pro charting, various types of order types, and portfolio tracker only at Pintu Pro.
*Disclaimer
This content aims to enrich readers’ information. Pintu collects this information from various relevant sources and is not influenced by outside parties. Note that an asset’s past performance does not determine its projected future performance. Crypto trading activities are subject to high risk and volatility, always do your own research and use cold hard cash before investing. All activities of buying and selling Bitcoin and other crypto asset investments are the responsibility of the reader.
Reference:
- Coinpedia. Top Five RWA Crypto Projects See Surge as Institutional Demand Builds. Accessed on March 20, 2026