XRP Remains Trapped Below $2, but Is This Capitulation or an Early Reversal Signal?
Jakarta, Pintu News – Over the past eight months, the price of XRP has continued to move in a fairly strong downward trend, so its trading volume has remained stuck in a limited range.
The price increase that occurred continued to form a pattern of lower highs and lower lows, and until now the movement has been held below the resistance area for more than a month. This condition makes the bullish impulse not strong enough to bring the price to break the $2 level.
One of the main reasons XRP has not been able to break the resistance at $1.5 and advance to $2 is because there is a large accumulation of XRP above that area. This pressure is now evident on the charts, as every time the price bounces up, the sell-off returns.
However, the weakening trend is starting to show a slowdown, as prices are no longer experiencing a sharp decline, but rather moving in a compression phase.
Realized Loss Spike Signals Capitulation Phase
Glassnode data shows a sharp rise in realized losses across various holder groups, especially in the 1 day-1 week and 1 week-1 month holding age categories. This indicates that new buyers are starting to exit their positions at a loss.
Read also: Solana Presents STRIDE and Incident Network to Enhance Security
Historically, such realized loss pools often appear around local bottoms, when weaker investors offload their assets and the supply is absorbed by stronger market participants.
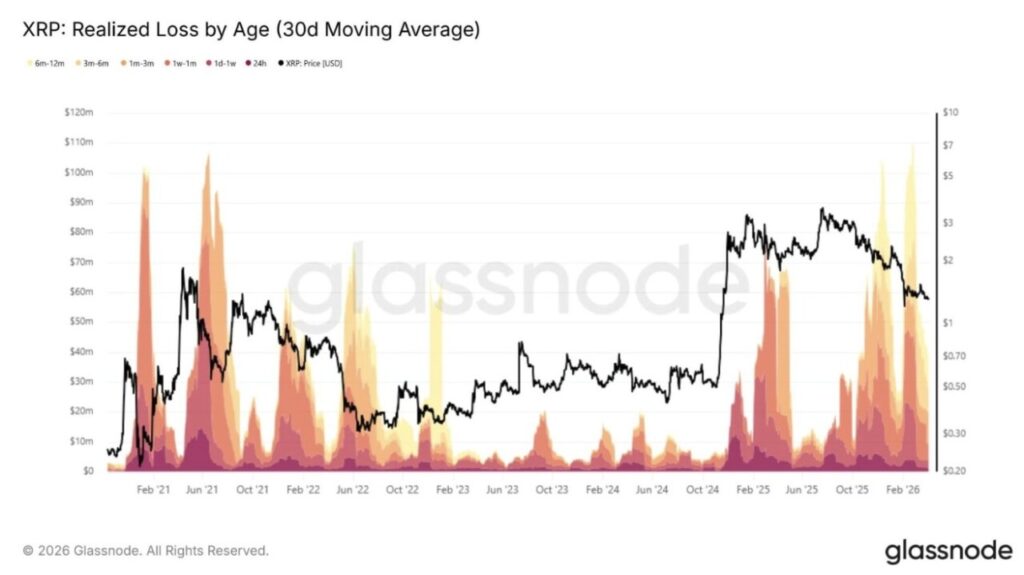
At the same time, the loss pressure that has also emerged in the longer holders group of 3 months-12 months suggests that medium-term holders – those who accumulated during the rally phase – are now giving up. This is in line with previous indications that most of the XRP supply is still underwater, thus reinforcing the view that the market has already gone through a phase of considerable pressure.
The data also shows that at the current price range, only 43.4% of XRP supply remains in profit, the lowest level since July 2024.
This kind of market behavior generally triggers volatility expansion, rather than a continuation of a narrow sideways movement phase.
XRP Price Experiences Compression at a Key Support Area
On the weekly chart, XRP is now entering a crucial phase where price structure, momentum, and market positioning begin to converge in one important area. Currently, XRP is consolidating between $1.27 support and the $1.35-$1.40 range, with deeper support at $1.12. This area is the starting point for buying interest after months of selling pressure.
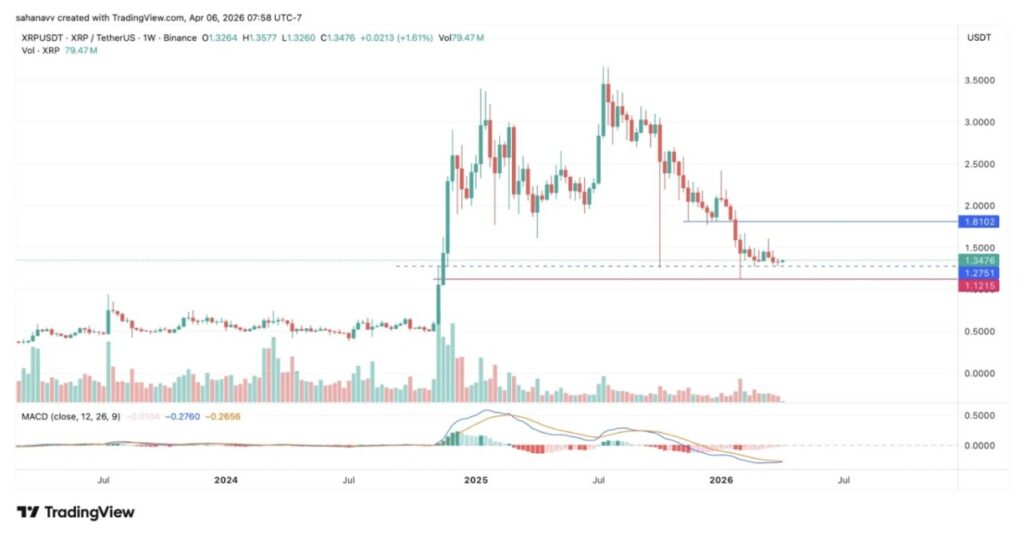
The MACD indicator is still in the bearish zone, with both lines remaining below the zero level, but is starting to point towards a potential bullish crossover. This suggests that momentum is likely to turn in favor of the bullish in the near term, as downward pressure begins to gradually weaken.
Read also: Pi Network Price Potentially Increases after V21.2 Protocol Upgrade, Can It Be Achieved This Month?
In addition, the selling volume also appears to have decreased compared to the initial breakdown phase, while the candle shape has narrowed, indicating volatility compression. As such, the XRP price seems to be preparing to enter a transition phase, although it is yet to show any direct reversal signals.
Key Levels that Determine the Next Move
The entire structure of XRP’s current movement centers on the following crucial levels:
- $1.27 → closest support or direction-defining level
- $1.12 → last support before deeper downside risks
- $1.80 → key resistance and trend invalidation level
As long as XRP is still trading below $1.80, the structure remains bearish. However, if the price is able to hold above $1.27, the market is still in a compression phase, which is when the chances of a breakout in either direction increase.
Conclusion: What’s Next for XRP Price?
Currently, the price of XRP is at a pivotal point after going through a prolonged downtrend, with the price movement starting to narrow near the $1.27 support zone while the bearish momentum continues to weaken.
Although the broader structure still looks weak as long as the price is unable to break $1.80, the current range shows signs of sellers’ exhaustion and opens a chance for volatility expansion.
If the price is able to hold strong above the support area, XRP could potentially recover towards $1.80. Conversely, if the $1.27 level fails to hold, downside pressure is likely to increase and push the price towards $1.12. Therefore, this area becomes the deciding zone for XRP’s next big move.
Follow us on Google News to stay up to date with the latest in crypto and blockchain technology. Check Bitcoin price, usdt to idr and tokenized nvidia stock price through Pintu Market.
As a safe crypto app, Pintu provides a crypto trading experience to access crypto gold investment easily and conveniently. You can also see today’ s gold jewelry price and today’s gold bullion price to support your investment activities and portfolio diversification as well as learn crypto through Pintu Academy.
Download the Pintu crypto app via Play Store or App Store now. Enjoy web trading experience with advanced trading tools such as pro charting, various types of order types, and portfolio tracker only at Pintu Pro.
*Disclaimer
This content aims to enrich readers’ information. Pintu collects this information from various relevant sources and is not influenced by outside parties. Note that an asset’s past performance does not determine its projected future performance. Crypto trading activities are subject to high risk and volatility, always do your own research and use cold hard cash before investing. All activities of buying and selling Bitcoin and other crypto asset investments are the responsibility of the reader.
Reference:
- Coinpedia. Here’s Why XRP Price is Stuck Below $2-Is This Capitulation or a Setup for Reversal? Accessed on April 8, 2026