As Ethereum Hits $2,300 Today, Key Indicators Flash a Strong Bullish Signal

Jakarta, Pintu News – Over the past month, Ethereum has outperformed both the general market and the top 10 large-cap digital assets. Its value rallied more than 12% amid war-induced macroeconomic volatility that altered the direction of capital flows.
Currently, some analysts are highlighting three specific signals that point to a bullish outlook for Ethereum price heading into the second half of April.
Ethereum Price Up 1.32% in 24 Hours
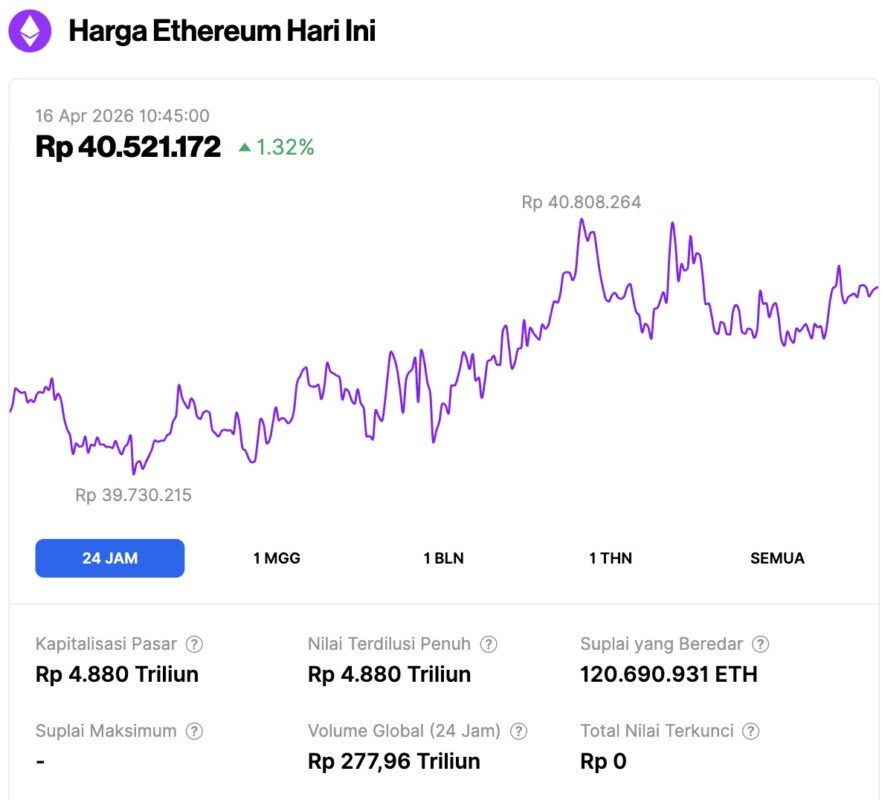
On April 16, 2026, the price of Ethereum was recorded at around $2,361 or the equivalent of IDR 40,521,172, an increase of 1.32% in the last 24 hours. During this period, ETH had touched its lowest level at IDR 39,730,215 and its highest level at IDR 40,808,264.
As of writing, Ethereum’s market capitalization now stands at around IDR 4,880 trillion, with daily trading volume falling 28% to IDR 277.96 trillion in the last 24 hours.
Read also: Bitcoin is Holding the Line at $75,000, but What’s the Next Move?ed Next?
Record Ethereum Network Activity Contrasts with Sluggish Price
Leon Waidmann, Head of Research at Lisk, highlighted that the Ethereum mainnet recorded 3.62 million transactions on April 12. The figure marks the first time the network has managed to process more than 3 million transactions in a single day.
According to Waidmann, the daily transaction trend has been steadily increasing since November 2025. The base number of transactions jumped from around 1.5 million to 2.5 million over the past six months. Combined with an influx of 284,000 new users in the first quarter and a record supply of stablecoins, these metrics point to continued organic growth in Ethereum’sbase layer.
Meanwhile, staking infrastructure provider Everstake noted that ETH is still trading more than 50% below itsall-time high, despite strong network activity. As such, the current price reflects a wide gap between network usage and market valuation.
“This creates a stark divergence, as network activity is at peak levels, while prices are yet to fully reflect such strength. Historically, such gaps tend to narrow over time,” the publication states.
“Ethereum stands on one of the strongest foundations it has ever had – record usage, a highly established ecosystem, and continued progress in scaling and development. In many ways, this highlights a simple dynamic: price often follows fundamentals, not the other way around. And those fundamentals are already forming.”
Read also: Could Altcoins Explode 100x in 2026?
Technical Indicators Show Bullish Signals
On the technical front, Crypto analyst Patel highlighted the Ethereum Rainbow Chart, a logarithmic regression tool that charts long-term valuation bands.
According to Patel, “Right now, the Ethereum Rainbow Chart conveys one simple message: it’s cheap. Not just ‘maybe buy’, ‘maybe wait’, or ‘save and hope’, but really cheap.”
He notes that ETH has only entered this area twice before, and on both occasions, the price managed to reach the upper limit or “Take Profit” range within 18 months.
Separately, Ash Crypto analysts highlighted the confirmation of a bullishcrossover on the weekly MACD indicator. The Moving Average Convergence Divergence (MACD) indicator tracks momentum changes over longer timescales. According to Ash Crypto, ETH’s previous two weekly MACD crossovers triggered price spikes of 183% and 75% respectively.
With ETH trading at around $2,346 on April 14, a 183% rally from current levels would take the asset to the $6,639 range, while a 75% gain would target the $4,105 mark.
Whether this combination of strong on-chain data and technical signals will translate into sustained price movement will likely depend heavily on broader macroeconomic conditions throughout the second quarter (Q2).
Follow us on Google News to stay up to date with the latest in crypto and blockchain technology. Check Bitcoin price, usdt to idr and tokenized nvidia stock price via Pintu Market.
As a safe crypto app, Pintu provides a crypto trading experience to access crypto gold investment easily and conveniently. You can also see today’ s gold jewelry price and today’s gold bullion price to support your investment activities and portfolio diversification as well as learn crypto through Pintu Academy.
Download the Pintu crypto app via Play Store or App Store now. Enjoy the web trading experience with various advanced trading tools such as pro charting, various types of order types, and portfolio tracker only at Pintu Pro.
*Disclaimer
This content aims to enrich readers’ information. Pintu collects this information from various relevant sources and is not influenced by outside parties. Note that an asset’s past performance does not determine its projected future performance. Crypto trading activities are subject to high risk and volatility, always do your own research and use cold hard cash before investing. All activities of buying and selling Bitcoin and other crypto asset investments are the responsibility of the reader.
Reference:
- BeInCrypto. 3 Bullish Signals Suggest Ethereum May Be Undervalued in April. Accessed on April 16, 2026