Analyzing 5 Bitcoin Top Cycle Indicators
The crypto bull market is one of the most exciting periods for many investors and traders. Since the Bitcoin bottom in November 2022, BTC has gone up almost 800% and many altcoins have gone parabolic in the same period. Additionally, many narratives have taken off in the crypto industry, such as AI, stablecoins, modular blockchains, restaking, etc. Now, into the third year of the bull market, investors and traders are preparing themselves for the cycle top. Everybody is wondering when and at what price Bitcoin will top this time. This article will discuss various cycle top indicators and how to use them.
Key Takeaways
- Bitcoin’s four-year cycle remains one of the most widely followed frameworks for predicting market tops, but historical patterns are not guaranteed to repeat.
- On-chain indicators such as MVRV-Z, Puell Multiple, and Pi Cycle Top provide useful signals, but each has limitations and should be used together for a fuller picture.
- External factors like institutional adoption, regulatory shifts, and macroeconomic conditions may extend this bull market beyond historical norms.
- Profit-taking and risk management strategies become crucial in the third year of the cycle, as historical data shows this is when parabolic moves and altseasons often occur.
What is the 4 Year Cycle in Bitcoin?
The Four-Year Cycle is a historical price action pattern seen on Bitcoin since its inception. The concept stems from Bitcoin halving, a significant event that affects the supply and demand dynamics in Bitcoin. Including the current one, Bitcoin has had five cycles.
Even though the data is still small (only 4 previous cycles), many believe the four-year cycle to be the de facto rule of the crypto market. In addition, some analysts think that Bitcoin’s four-year cycle also coincides with the movement of global money supply.
If we convert it to months, the average crypto bull market lasts for around 35 months with a 12-month bear market in the following year.
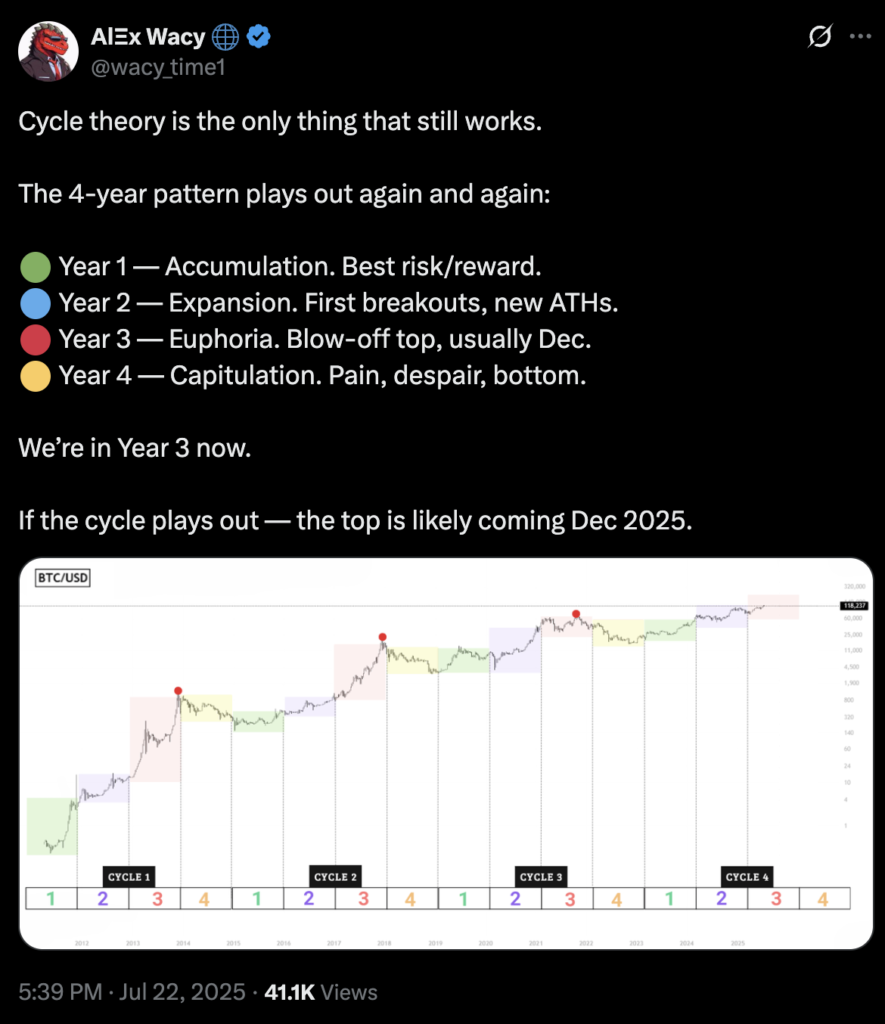
We are currently in the third year of the 2022-2026 cycle. Historically, the third year is where Bitcoin goes parabolic and blasts through its old all-time high. In 2017 and 2021, the third year of the cycle also coincides with the so-called altseason, when altcoins go “up-only.”
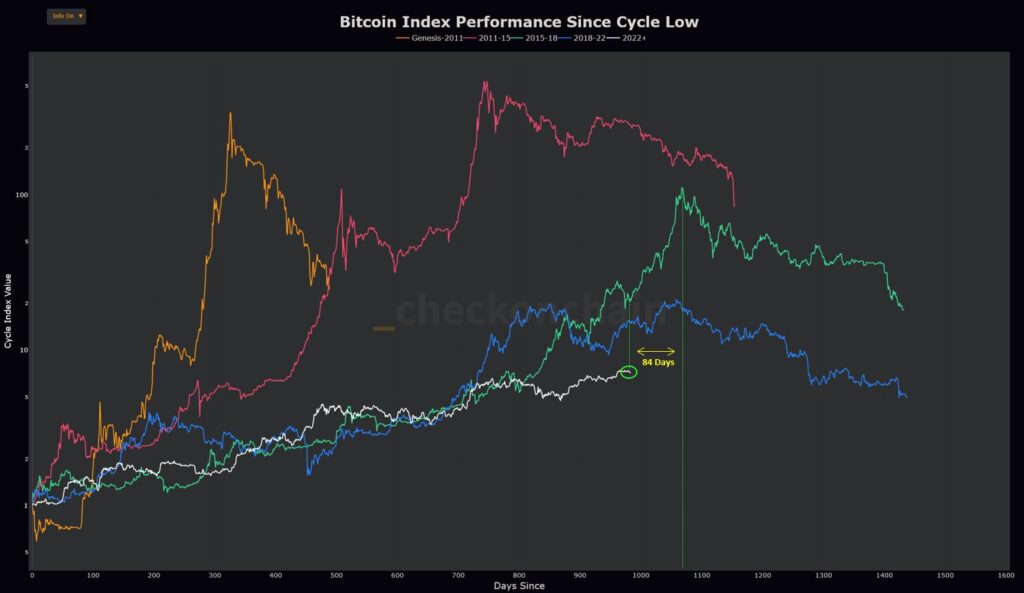
Additionally, investors and traders are also expecting 2025 to mark the cycle top. The graph above shows that BTC topped around 1000 days after the cycle started (in 2017 and 2021). However, some analysts and people in the crypto community predicted a change in the current cycle.
5 Cycle Top Signals and Indicators
Below, we will look at 5 cycle top indicators and signals to help you identify the current market dynamic.
1. Historical Price Chart
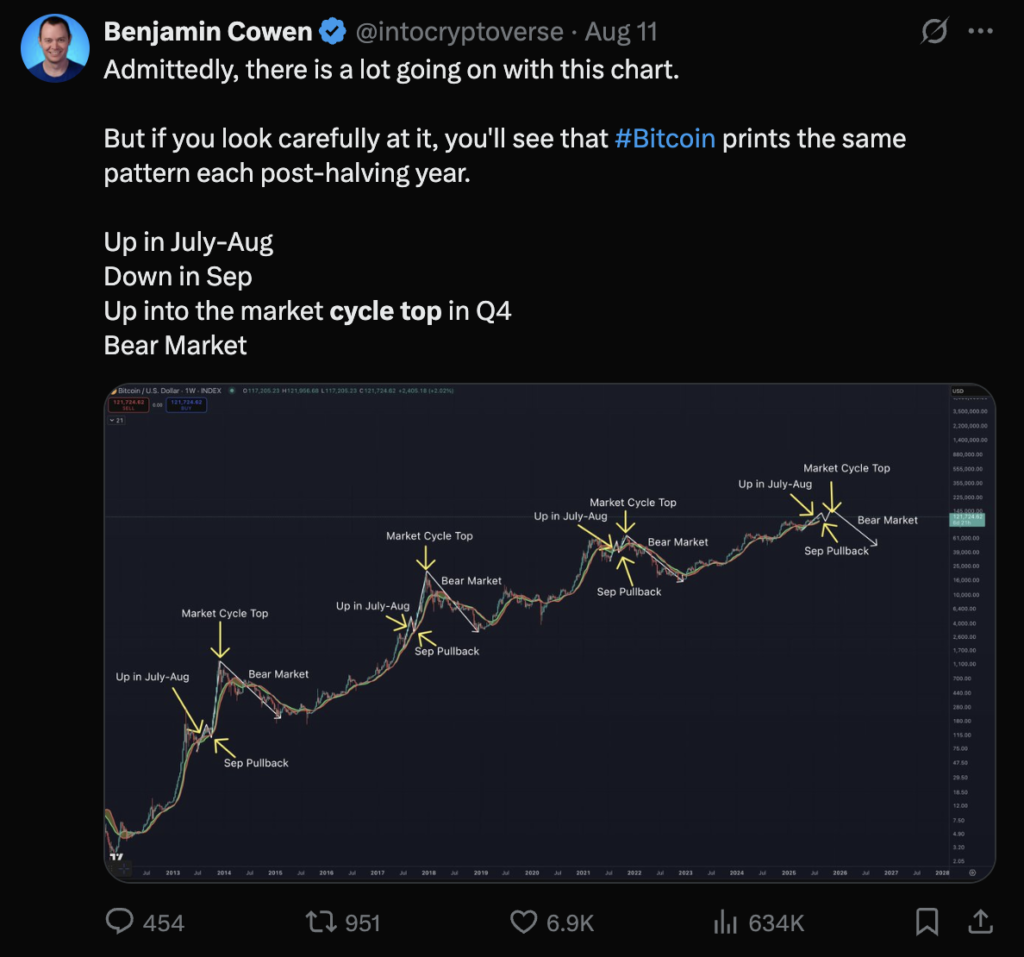
As previously explained, one of the easiest ways to predict the crypto market top is by using the historical price chart. Following this model, the current cycle will top out at around October or November 2025.
All of the previous cycles always point to a Q4 rally ending in a market top. As Benjamin Crowen mentioned above, there is an uncanny similarity when it comes to price action in Q4 for each post-halving year.
Historical price action can only give a very rough estimation of the cycle top. As we’ve seen in 2021, Bitcoin formed a double top, which was the first time that it happened. However, knowing that the top will happen around October to December can help you form your profit-taking strategy.
2. MVRV-Z
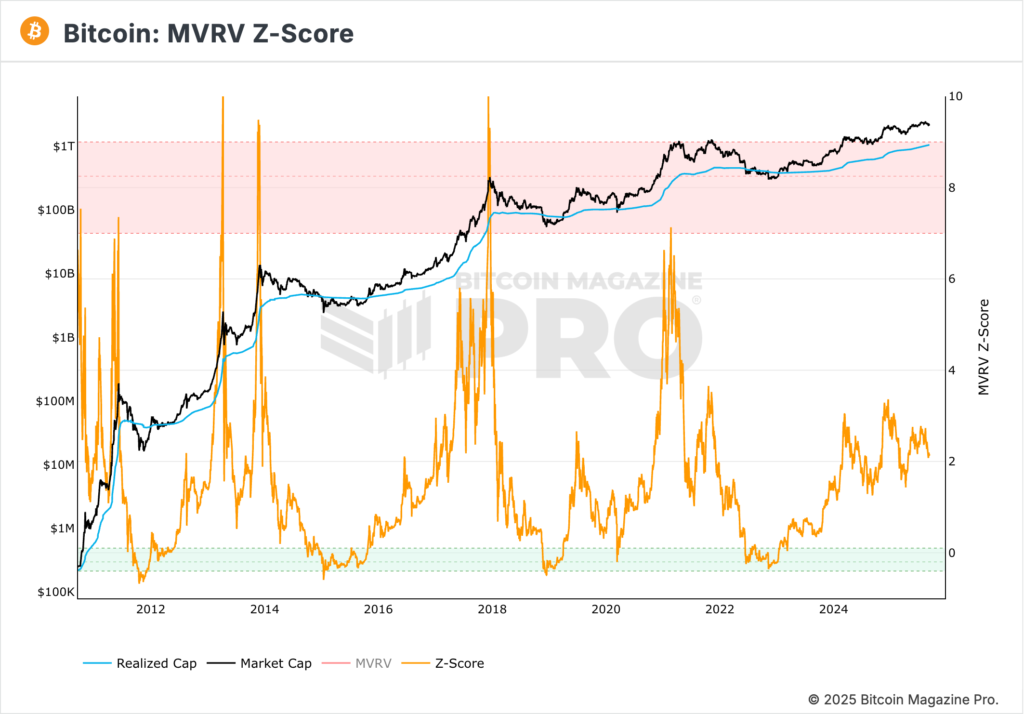
The MVRV-Z (Market Value to Realised Value Ratio) indicator is an on-chain metric for measuring Bitcoin’s value relative to its ‘fair value’. Market value (black line) or market cap is the current price of Bitcoin multiplied by the circulating supply. Realized value (blue line) is the price of each Bitcoin when it was last moved to measure the buy and sell price.
The Z score (orange line) normalises the data by taking out the extremes between market value and realised value. In the chart above, the orange line is the most important line that measures the MVRV-Z ratio. The red zone indicates ‘overvalued’ as most people are in profit and market value is far above realized value.
On the flipside, buying Bitcoin at the green zone has been proven to be very profitable, as it coincides with the bottom price. This has been proven over multiple cycles, as you can see in the image above.
In previous bull markets, the MVRV-Z score always reached above 6 around the top of the cycle.
- 2017: Hit 9 around the peak of the cycle
- 2021: Hit 7 at the peak of the cycle
We are currently at around 2 (per September 9), indicating that there is still much room for Bitcoin to rise. However, the November 2021 top happens when the MVRV-Z score is around 3, so it shows the data isn’t 100% accurate.
3. Puell Multiple
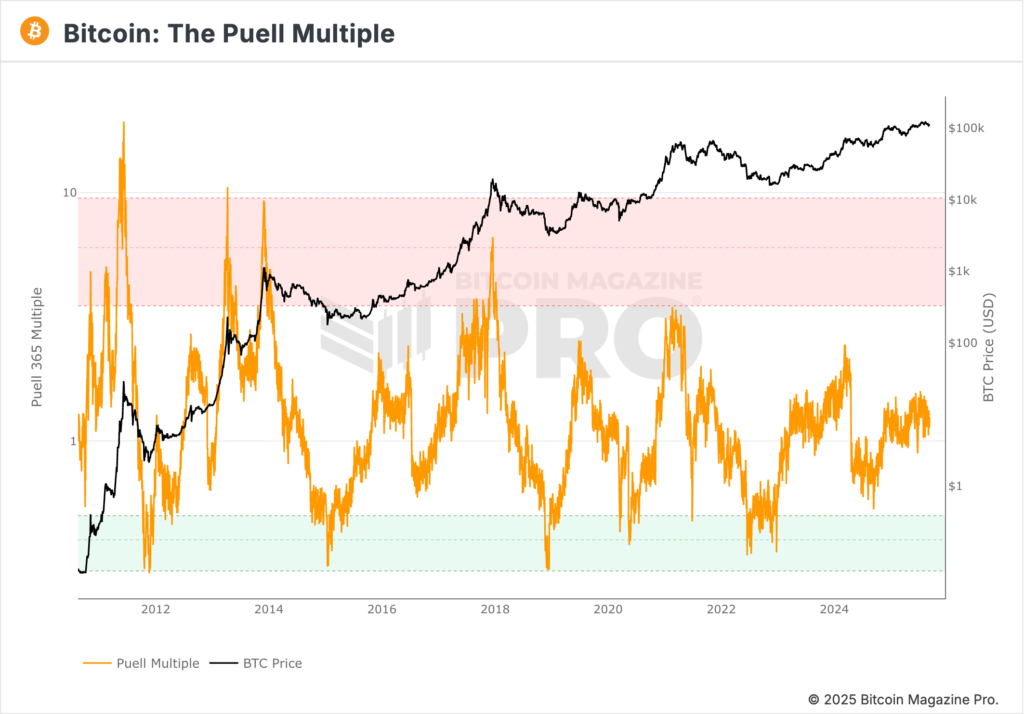
The Puell Multiple is an on-chain indicator that examines Bitcoin miners and their revenue, the supply side of Bitcoin’s economy. This indicator measures the market cycle from the perspective of mining revenue. Miners are compulsory sellers as they need to cover the cost of mining hardware and daily operations. Thus, miners’ revenue can influence price over time.
The Puell Multiple is calculated by dividing the value of Bitcoin’s daily issuance (in USD) by the 365-day MA of daily issuance value. To put it simply, miners’ revenues are significantly higher than the average when the line enters the red zone and lower when it enters the green zone.
As can be seen, the Puell Multiple line is right around the center between the green and red zones. What is interesting is that you can see that the Puell Multiple lines experience lower highs after every cycle. In 2021, the Puell Multiple barely reached the red box at around 3.4, while the 2017 highs reached as high as 6.6.
4. Rainbow Chart
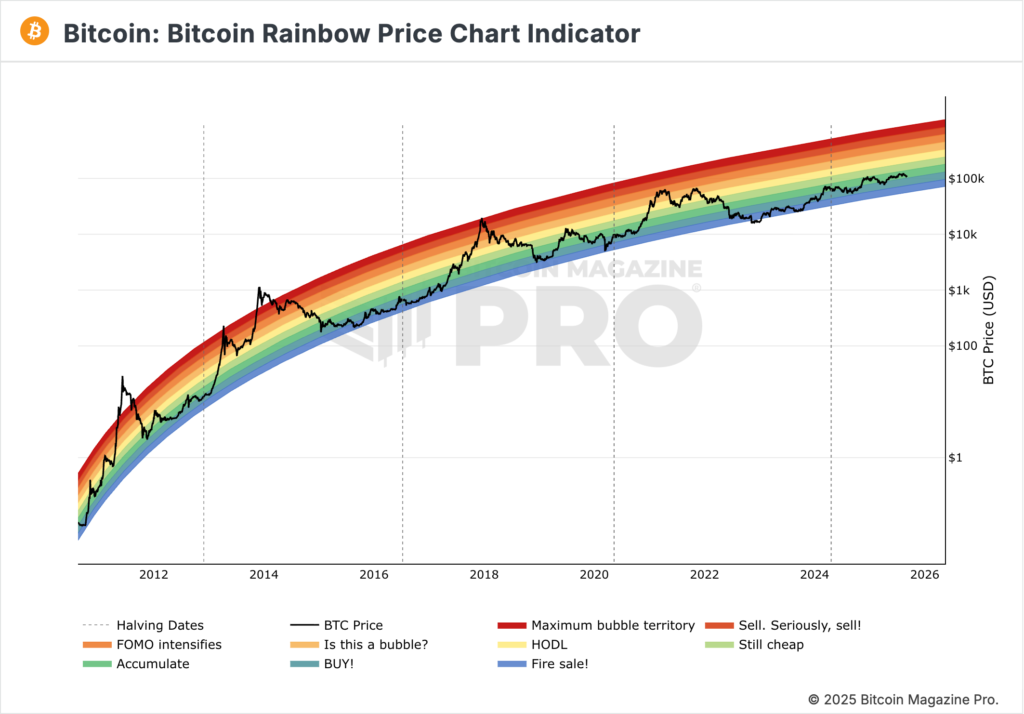
Bitcoin Rainbow price chart is a long-term valuation tool that uses a logarithmic growth curve. The chart forecast potential price direction for Bitcoin. Besides the curve line, it overalys rainbow color bands to highlight sentiment at each stage of the curve.
Generally, the zone below the yellow line is a good price to buy, while above the yellow line indicates an overpriced area. The Rainbow price chart is often used as a meme after the 2021 bull market.
In 2021, the price did not reach the top of the curve and people started to lose faith in the indicator. However, this indicator is still useful in conjunction with other cycle top indicators.
5. Pi Cycle Top
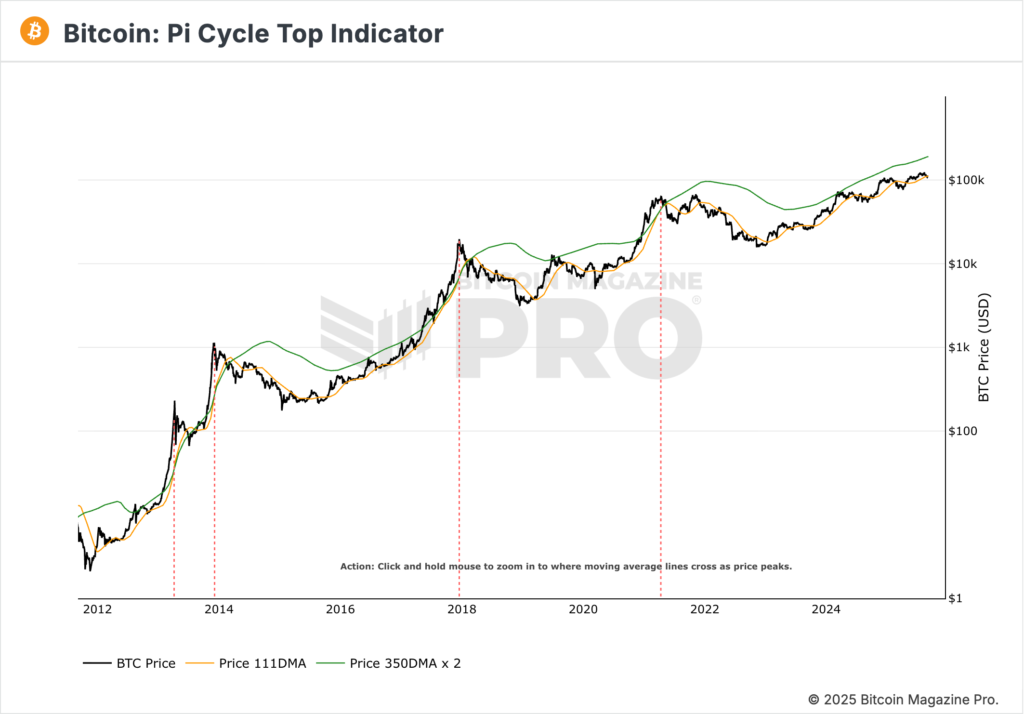
The Bitcoin Pi cycle top is a simple indicator that combines two moving averages to spot the Bitcoin top. The yellow line is a 111-day moving average and the green line is the 350-day MA multiplied by 2. The cycle top happens when the 111-day MA crosses above the 350-day MA x 2.
Fun Fact: The name ‘Pi Cycle’ comes from 350 divided by 111, which results in 3.153, very close to Pi (3.142).
Under normal market conditions, the 111-day MA price stays well below the green line. However, the short-term MA will eventually cross the 350-day MA x 2 during a parabolic Bitcoin run.
The Pi Cycle Top indicator has nailed the top within days. A lot of people think that this is one of the most accurate top indicators. However, we still don’t know what will happen now that Bitcoin has constant demand from ETFs and Treasuries.
Is This Time Different? 3 Reasons for an Extended Bull Market
- Institutional vs Retail Behavior: Prior crypto cycles are dominated by retail traders and investors. In the current cycle, ETFs and institutional flows are the catalysts for several up-only price actions. Naturally, these are very different kinds of market participants that can change the flow of liquidity and the established cycle.
- Regulatory Shift Towards Crypto: In previous cycles, a negative attitude towards crypto has contributed to bear market formation and triggered the cycle top for Bitcoin. We are now in a completely opposite regulatory landscape. The US, the SEC, and BlackRock are some of the largest supporters of crypto. Additionally, the US has now passed the first crypto legislation in the GENIUS Act (for stablecoin).
- Macroeconomics and the Fed: The 2022 bear market was worsened by the Fed’s decision to significantly raise interest rates. Right now, the Fed is on the cusp of lowering interest rates, which historically has been the catalyst behind risk-on assets rallies. In addition, a new Fed chair will take charge in 2026. So, Donald Trump would want a chair that would facilitate his desire to cut rates.
Conclusion
The crypto bull market has already delivered massive returns, and as history shows, the third year of Bitcoin’s cycle often brings both explosive gains and heightened risks. By combining historical cycle data with on-chain indicators and paying close attention to macroeconomic and institutional trends, investors can better position themselves for what may lie ahead. While no single signal can predict the exact cycle top, preparing a strategy that balances profit-taking with risk management is essential. Whether this cycle ends the same way as before or extends into new territory, being disciplined and data-driven will be the key to navigating the final stretch of this bull run.
How to Invest and Trade Cryptocurrencies on Pintu
You can start investing in cryptocurrencies by buying them in the Pintu app. You can trade BTC, ETH, and SOL in spot and futures directly in Pintu Pro. Here are the key advantages of Pintu Pro:
- Comprehensive trading tools such as charting
- A wide variety of order types
- Real-time order book
- Portfolio tracker to monitor your assets
- Lower trading fees
- Open long or short positions with leverage up to 25x
Pintu Pro allows you to trade both Futures and Spot in one place, making it practical and efficient.
Here’s how to trade Crypto Futures on Pintu Pro:
- Visit https://pintu.co.id/
- Click the Open Pro on Desktop button at the top center.
- Register or log in to Pintu Pro Web.
- Navigate to the Futures section.
- Start trading BTC and other cryptocurrencies.
Click the following link to access Pintu Pro via desktop or app.
References
- Decentralized Dog, “Crypto Market Cycle Indicators: Your Complete Guide to Spotting Bitcoin’s Peak“, CoinMarketCap, diakses pada 8 September 2025.
- “MVRV Z-Score”, Bitcoin Magazine Pro, diakses pada 8 September 2025.
- “The Puell Multiple“, Bitcoin Magazine Pro, diakses pada 9 September 2025.
- “Bitcoin Rainbow Price Chart Indicator“, Bitcoin Magazine Pro, diakses pada 9 September 2025.
- “Pi Cycle Top Indicator“, Bitcoin Magazine Pro, diakses pada 9 September 2025.
- @LDNcryptoclub, “Been asked about when we think this Bitcoin and crypto cycle tops and if we’ve broken the 4 year cycle We believe the 4 year cycle has been at least extended to the end next year if not completely broken The crypto cycle typically syncs with the macro and liquidity cycle which”, X, diakses pada 10 September 2025.
- @Alpha_pls, “Four-Year Cycle Top vs Extended Cycle to 2026”, X, diakses pada 10 September 2025.
Share