Market Analysis 10-16 Apr: Bitcoin Falls, Ethereum Merge Delayed, and Beanstalk Hacked

Bitcoin (BTC) and Ethereum (ETH) price movement between 10-16 April
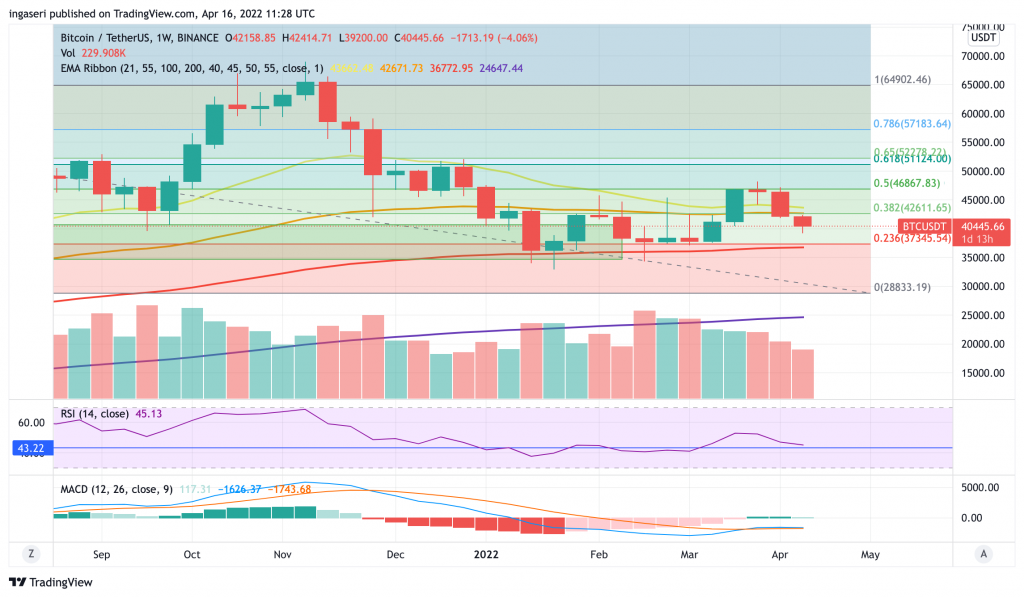
Over the past week, the price of BTC has been stuck at the 0.382 Fibonacci Retracement line which coincides with the 55-week EMA. The price has been in a downtrend since the 20-week MA crossed below the 50-week MA.

On the daily chart, we can see that BTC tried to break the 100-day EMA resistance on April 10 but failed again after several attempts. BTC also forms a higher low and a bear channel on a weekly basis.
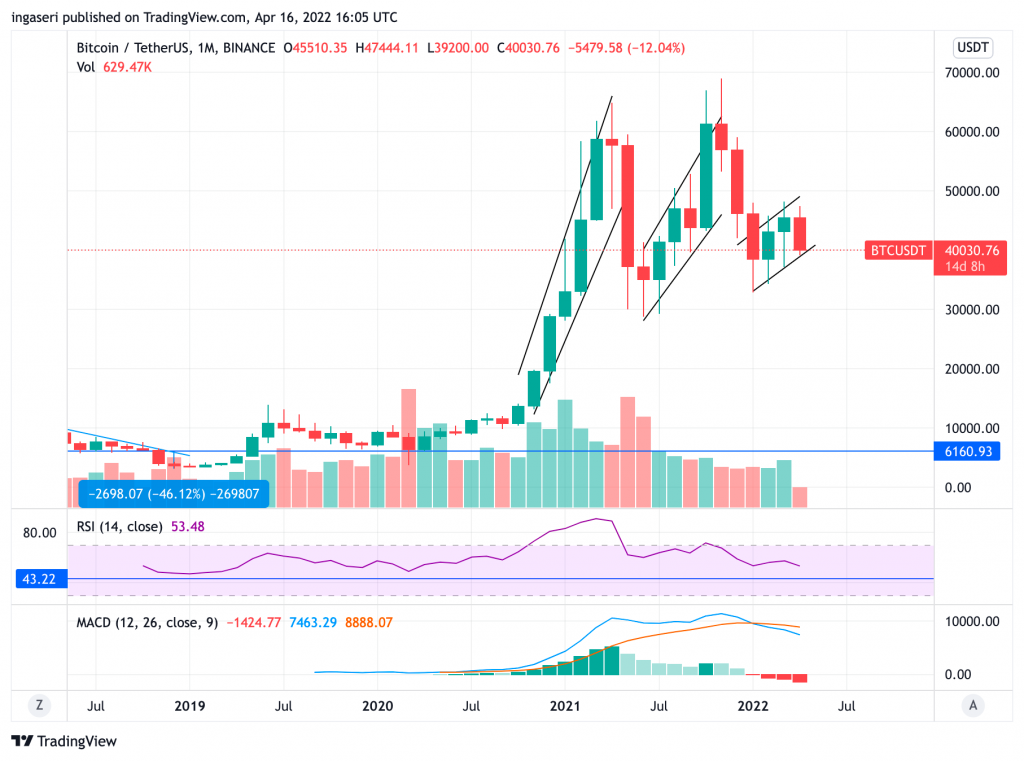
On the monthly chart, BTC is showing a consistent bear flag, trending up inside the pattern, testing the support again, then making a higher low. Note that in the last 2 bear flags, the price is facing serious retracements.

The inflation data (CPI) for March came out and is currently at 8.5%, +0.6% from 7.9% in February. This is the highest increase in Inflation since 1981. As explained last week, the minutes of the Fed’s March meeting showed that they were aggressive in reducing inflation, and many suggested a 0.5% rate hike, a figure higher than expected. The Federal Reserve will hold its policy-setting meeting on May 3 and 4. Until then, markets will be anxiously awaiting the Fed’s next action.
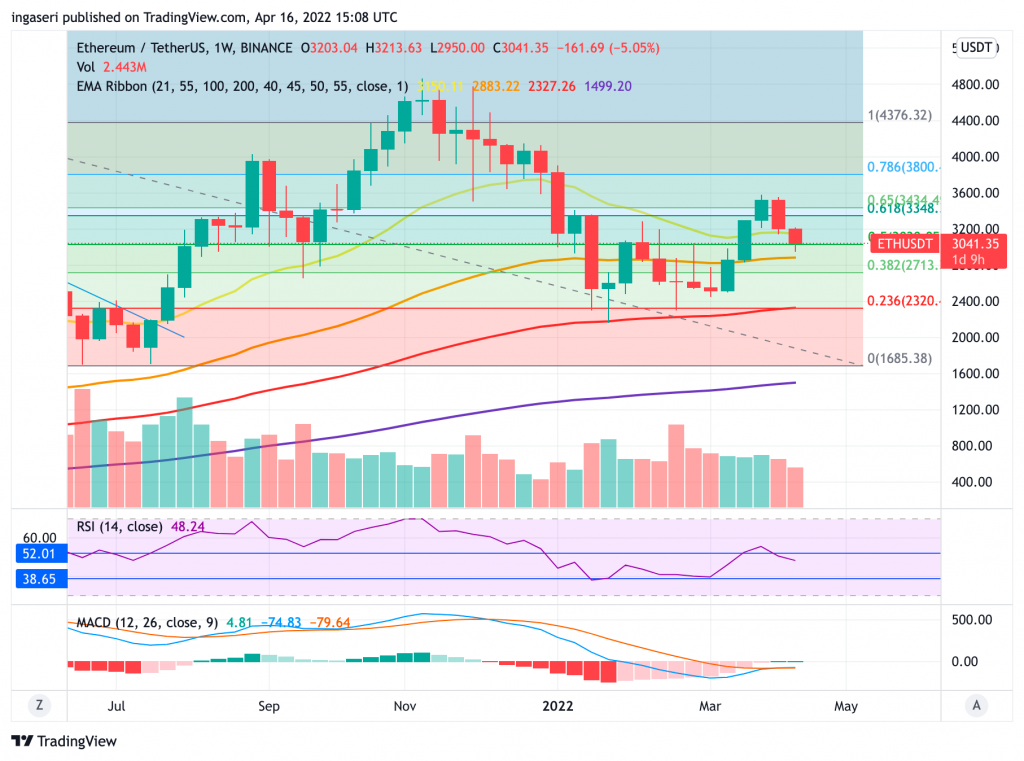
Lastly, Ethereum (ETH) weekly chart shows its price falling below the 21-week EMA again after 2 weeks of holding above it. While it appears that ETH performed strongly two weeks ago, given that it crossed the Golden Fibonacci pocket and its weekly RSI has broken through strong resistance, it retraces back to the 0.618 Fibonacci lines. This is consistent with the weak BTC price over the past 2 weeks. The price is currently supported by the 0.5 Fibonacci retracement line at $3030. In addition, resistance levels are at $3350 and $3450.
What else is there to observe from the market in the past week?
 bitcoin-exchange-net-position-1-1024x576.png" alt="Market Analysis 10-16 Apr" class="wp-image-3359" srcset="https://pintu-academy.pintukripto.com/wp-content/uploads/2022/04/Grafik-bitcoin-exchange-net-position-1-1024x576.png 1024w, https://pintu-academy.pintukripto.com/wp-content/uploads/2022/04/Grafik-bitcoin-exchange-net-position-1-300x169.png 300w, https://pintu-academy.pintukripto.com/wp-content/uploads/2022/04/Grafik-bitcoin-exchange-net-position-1-768x432.png 768w, https://pintu-academy.pintukripto.com/wp-content/uploads/2022/04/Grafik-bitcoin-exchange-net-position-1-1536x864.png 1536w, https://pintu-academy.pintukripto.com/wp-content/uploads/2022/04/Grafik-bitcoin-exchange-net-position-1-1200x675.png 1200w, https://pintu-academy.pintukripto.com/wp-content/uploads/2022/04/Grafik-bitcoin-exchange-net-position-1.png 1800w" sizes="(max-width: 1024px) 100vw, 1024px">
- The 30-day change of Bitcoins positions in exchange wallets has been significantly reduced. Note that the previous 3 declines showed a local bottom in the BTC price before it started to rise.
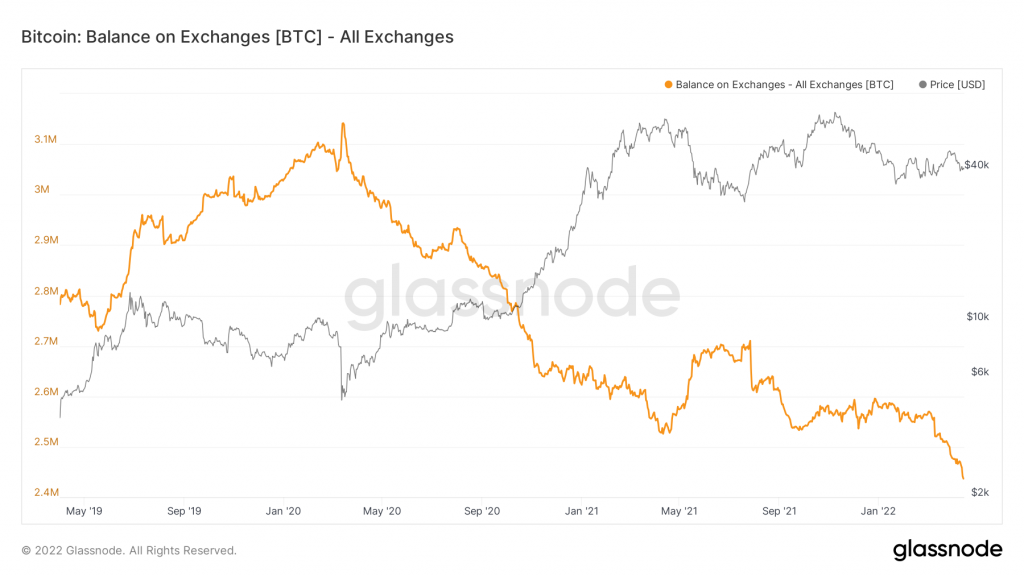
- Since early March, Bitcoin’s balance on exchanges has been steadily declining. Luna Foundation Guard (LFG) led a number of large BTC purchases. This is a good sign, considering that prices in the market are sideways, having a balance that is at the same level as the middle of 2018 means that Bitcoin demand is still high.
News from the altcoin world
- 🌕 Terra integrates with Polkadot: Acala, one of the blockchains built on the Polkadot network, announced that they are working with Anchor Protocol, the largest savings and loan application on Terra. Acala and Anchor plan to use DOT tokens as well as KSM as collateral for the Anchor application. In addition, Acala also wants to create a liquidity pool consisting of aUSD (owned by Acala) and UST (Terra). This is done to increase liquidity as a sign of collaborative cooperation in the development of the two stablecoins.
- 🤑 Ava Labs valuation reaches $5 billion dollars: Ava Labs, the organization Avalanche , plans to raise a new round of funding of $350 million that will increase its valuation to $5.25 billion. As one of the most popular blockchains and crypto assets, Avalanche also has a market cap of $20.7 billion dollars.
Other important news from the crypto world in the last week
- 🦹 The Axie Infinity hacker is suspected to be from North Korea: The US Treasury announced that the North Korean hacker group Lazarus was linked to the Axie Infinity hack which resulted in a $625 million dollar loss. The US Treasury is currently working with the FBI to further investigate the group’s involvement. Meanwhile, Axie Infinity explained that they are in the process of updating the Ronin Bridge security.
- 🌐Merge Ethereum 2.0 postponed: Tim Beiko, one of the main developers of Ethereum, explained that the update called “The Merge” will be delayed by several months. Previously, the Ethereum network update was planned to be implemented in June. The update will merge the two sides of Ethereum namely the proof-of-work (PoW) and proof-of-stake (PoS), completing the migration of the Ethereum network to the PoS side.
- 🔥 Terraform Labs donates funds to Terra foundation: The Luna Foundation Guard (LFG) recently received a grant from Terraform Labs of 10 million LUNA equivalent to $820 million dollars. Terraform Labs is the organization behind the development of the Terra network while LFG is the foundation created specifically to regulate the economy of LUNA as well as UST. This token award is likely part of LFG’s plan to increase its cash reserves to maintain the value of UST.
- ⛔ Beanstalk DeFi protocol lost $182 million dollars: A stablecoin protocol on Ethereum, Beanstalk Farm, recently suffered a flash loan attack. The perpetrator managed to drain funds from the protocol and made a profit of $80 million dollars in various crypto assets. In addition, BEAN, the crypto asset of Beanstalk, fell by as much as 80% in response to the news of the attack.
References
- Dan Reecer, Anchor Protocol and Acala Integrating to Unite Terra and Polkadot DeFi Ecosystems and Grow Decentralized Stablecoin Market, Acala on Medium, accessed on17 April 2022.
- Zhiyuan Sun, Ava Labs raises $350M at $5.25B valuation: Report, Coin Telegraph, accessed on 17 April 2022.
- Nikhilesh De, Danny Nelson, US Officials Tie North Korea’s ‘Lazarus’ Hackers to $625M Crypto Theft, Coin Desk, accessed on 17 April 2022.
- Sam Kessler, Ethereum Merge No Longer Expected in June, Coin Desk, accessed on 17 April 2022.
- Brian Quarmby, Terraform Labs gifts another $880M to Luna Foundation Guard, accessed on 17 April 2022.
- Sam Kessler, Attacker Drains $182M From Beanstalk Stablecoin Protocol, Coin Desk, accessed on 18 April 2022
Share
Related Article


See Assets in This Article
ETH Price (24 Hours)
Market Capitalization
-
Global Volume (24 Hours)
-
Circulating Supply
-