Market Analysis April 15th, 2024: Bitcoin Tumbles Amidst Middle East Crisis

Last weekend, the world was shocked by Iran’s attack on Israel. This act immediately sparked anxiety among various parties. As the attack unfolded, financial sectors, including the crypto market, reacted negatively, witnessing price drops across almost all crypto assets. How significant was the impact of this conflict on suppressing crypto prices? Check out the analysis below.
As usual, the Pintu trading team has gathered critical information and analyzed the general economic situation and the crypto market’s movements over the past week. However, it should be noted that all information in this Market Analysis is intended for educational purposes, not as financial advice.
Market Analysis Summary
- ⚠️ The crypto market remains bearish. Bitcoin has been unable to break the $71,000 mark. Instead, it fell 8% in response to the Iran-Israel conflict.
- 💼 In March, total employment experiences a rise of 303,000, while the unemployment rate remains steady at 3.8%.
- 📈 The unexpected surge in gas prices and soaring mortgages and rent caused inflation to rise more than anticipated in March
- 💪🏻 Jobless claims declined to 211,000, indicating continued strength in the labor market.
Macroeconomic Analysis
Unemployment Rate
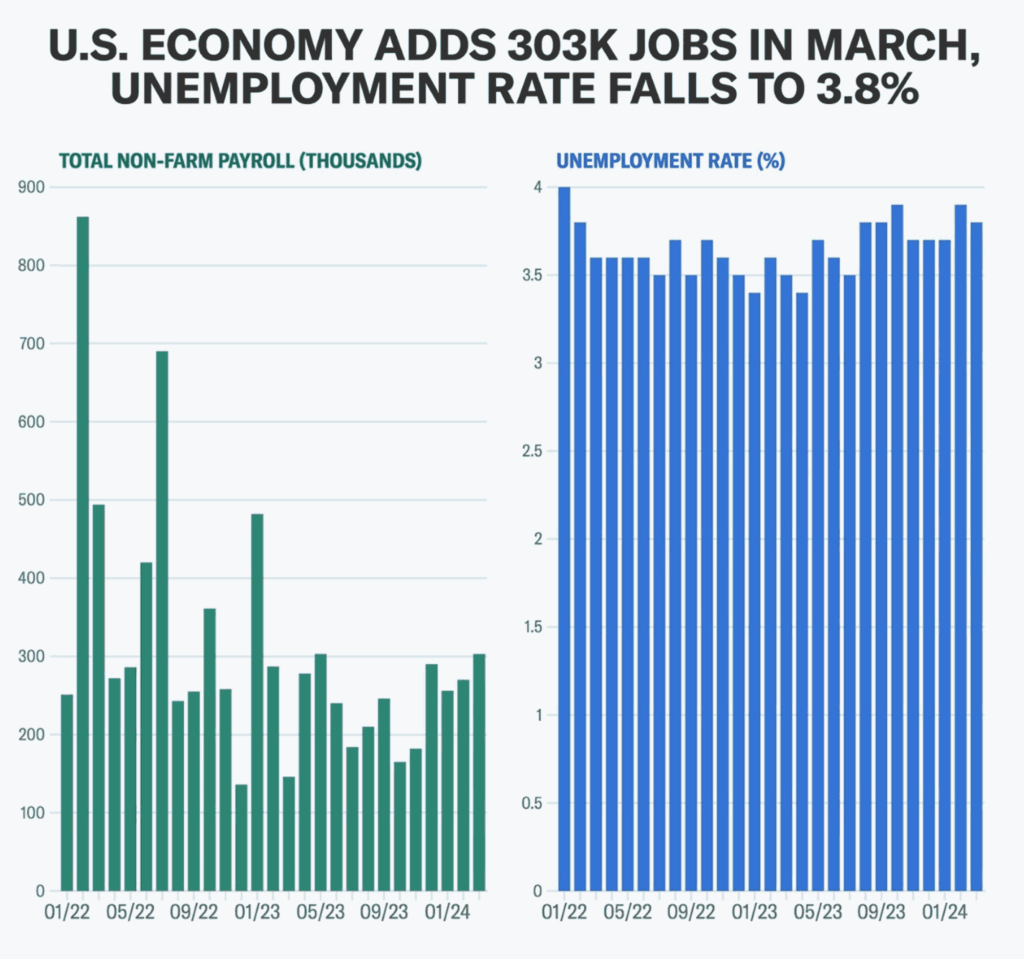
The U.S. Bureau of Labor Statistics announced that in March, total nonfarm employment saw a notable increase of 303,000, maintaining the unemployment rate at 3.8%. Key sectors experiencing significant job gains included healthcare, government, leisure and hospitality, and construction.
The report highlighted that March’s job growth surpassed the 12-month average of 231,000. Job gains were particularly notable in healthcare (72,000), government (71,000), construction (39,000), leisure and hospitality (49,000), other services (16,000), and social assistance (9,000). However, industries such as mining, oil and gas, transportation and warehousing, financial activities, manufacturing, and professional and business services saw relatively stagnant job growth.
Other Economic Indicators
- Consumer Price Index (CPI): Consumer prices in the US rose by 3.5% in March compared to the previous year, according to the latest data from the Bureau of Labor Statistics. This increase, driven by a surge in gas prices and rising mortgage and rental costs, was the largest in the past six months and exceeded February’s rate of 3.2%. The report reduced the likelihood of an interest rate cut by the Federal Reserve in the near future, as evidenced by the significant decline in the market’s probability of a June rate cut to 21%. It also triggered a sharp drop in stock market indices, with the Dow Jones Industrial Average falling by more than 500 points. While monthly price changes remained stable at 0.4% compared to February, rising gas and shelter costs were particularly influential. Core inflation, which excludes volatile food and energy prices, held steady at an annualized rate of 3.8%.
- Jobless Claims: The US labor market showed its strength this week. The number of claims for unemployment benefits fell to a five-week low of 211,000. This decline came despite expectations of a slowdown in the labor market due to high interest rates. So far this year, jobless claims have been in a narrow range between 194,000 and 225,000, indicating the economy remains strong with steady growth and significant job additions each month. Despite an increase in the number of individuals receiving benefits to 1.82 million, there was no indication of a change in trend in the claims data with the uninsured rate remaining at 1.2%.
- Producer Price Index (PPI): In March, the US Producer Price Index (PPI) for final demand increased by 0.2% compared to the previous month, falling short of expectations of a 0.3% increase. Final demand services within the PPI rose by 0.3% month-on-month, while final demand goods experienced a slight decline of -0.1% month-on-month. Over the 12-month period, the PPI surged from 1.6% year-on-year to 2.1% year-on-year, which was slightly lower than the expected 2.3% year-on-year increase. Nevertheless, this figure marked the highest reading since April 2023. The PPI for final demand, excluding goods, energy, and trade services, increased by 0.2% month-on-month. Over the same 12-month period, the PPI for final demand, excluding foods, energy, and trade services, rose by 2.8% year-on-year.
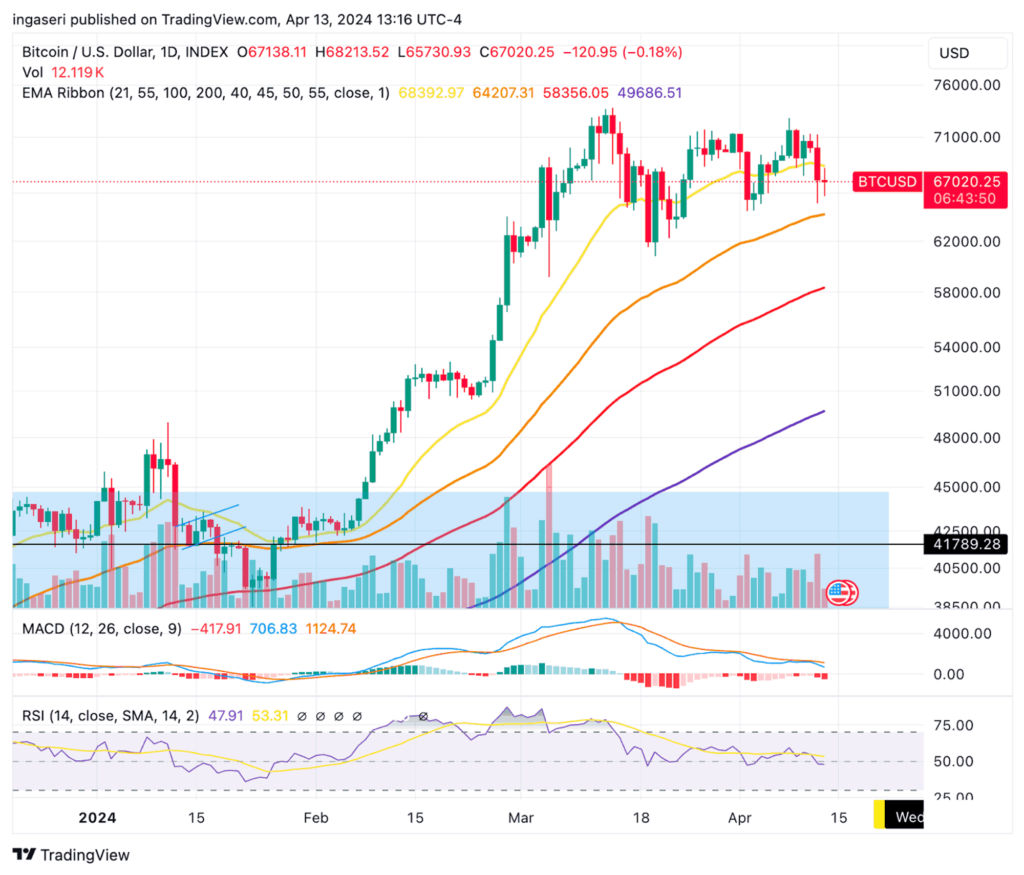
BTC Price Analysis
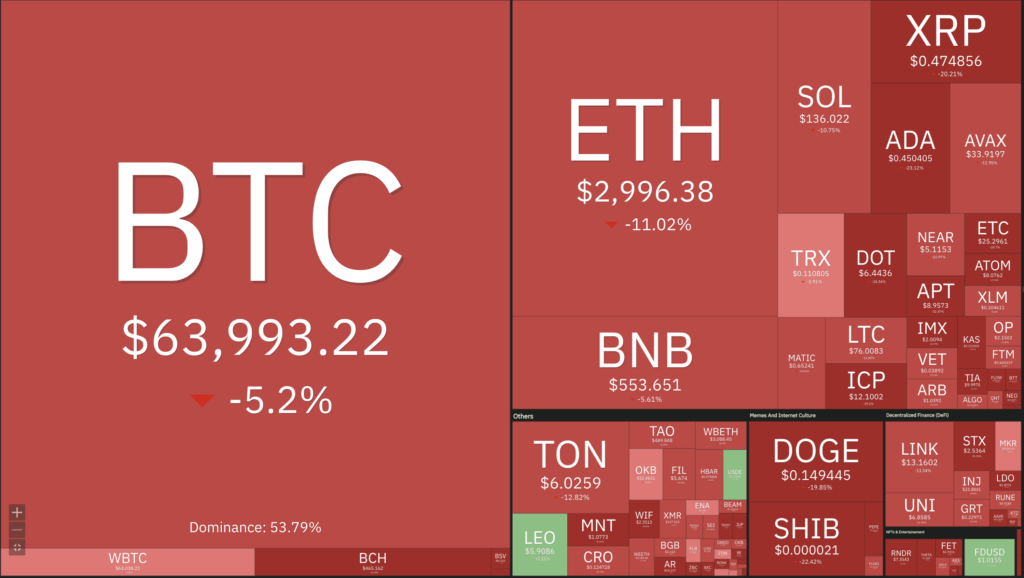
Bearish forces are still ruling the crypto market as of late, with BTC unable to break the $71K mark. Even on Sunday, BTC’s price touched $61K again. Other cryptocurrencies have seen more drastic price drops. ETH, for example, has dropped to $2,900.
Further losses have been observed across various al coins. The sharp fluctuations in prices have led to significant liquidations among over-leveraged traders, with nearly $500 million liquidated in just the past hour and over $800 million in the past 12 hours.
On-Chain Analysis
- 📊 Exchange: As the exchange reserve continues to rise, it indicates higher selling pressure. Net deposits on exchanges are high compared to the 7-day average. Higher deposits can be interpreted as higher selling pressure.
- 💻 Miners: Miners’ are selling holdings in a moderate range compared to its one-year average. Miner’s revenue is in a moderate range, compared to its one-year average.
- 🔗 On-Chain: More investors are selling at a profit. In the middle of a bull market, it can indicate a market top. Long term holders’ movement in the last 7 days was lower than the average. They have a motive to hold their coins. Investors are in a ****belief phase where they are currently in a state of high unrealized profits.
- 🏦 Derivatives: Long-position traders are dominant and are willing to pay to short traders. Selling sentiment is dominant in the derivatives market. More sell orders are filled by takers. As OI increases, it indicates more liquidity, volatility, and attention are coming into the derivative market. The increasing trend in OI could support the current ongoing price trend.
- 🔀 Technicals: RSI indicates a neutral condition. Stochastic indicates a neutral condition where the current price is in a moderate location between the highest-lowest range of the last 2 weeks.
News About Altcoins
- A report from blockchain security firm Blockaid reveals that 50% of presale token launches on the Solana network are scams. Amid booming meme coin activity on the platform, the report emphasizes the vulnerability of users attracted by the potential for quick profits and the fear of missing out (FOMO) in a rapidly fluctuating market. Scammers are utilizing platforms such as Telegram, Twitter, and Discord to mislead users into engaging with malicious websites and addresses, exploiting the heightened interest around meme coins and the overall market recovery. This trend of presale token scams mirrors fraud strategies common in other cryptocurrency ecosystems. Blockaid’s investigation has noted a sharp increase in interest in presale tokens on Solana, jumping from just a few to several hundred in a matter of months, largely driven by the emergence of legitimate meme coins. The report also points to a possible lack of security measures in the Solana ecosystem, making it an easy target for fraud.
News from the Crypto World in the Past Week
- Bitcoin Price Plummets Amid Middle East Tensions. The price of Bitcoin experienced a dramatic drop, falling towards $60,000 after peaking above $70,000 earlier this week. This followed the announcement from Iran’s Revolutionary Guard of missile and drone attacks on Israeli territory. These geopolitical tensions not only impacted Bitcoin, but also suppressed the broader cryptocurrency market, including coins such as Ethereum, BNB, XRP, Solana, and Dogecoin, wiping around $500 billion off the combined market value. The escalating conflict between Iran and Israel, exacerbated by recent exchanges including Iranian strikes in response to previous Israeli actions, has raised fears of a wider regional war. These developments have affected global markets, with traditional safe haven assets such as gold experiencing a surge in price, while oil prices have also risen on concerns of potential supply disruptions. This volatile situation is in stark contrast to the typically bullish outlook for cryptocurrencies, highlighted by recent enthusiasm for new Bitcoin ETFs and upcoming halving events.
Cryptocurrencies Market Price Over the Past Week
Cryptocurrencies With the Best Performance
- Toncoin +9,81%
- Neo +1,98%
Cryptocurrencies With the Worst Performance
- Wormhole (W) -48,08%
- Conflux (CFX) -42,01%
- Uniswap -40,59%
- Worldcoin 38,48%
References
- Billy Bambrough, Israel-Iran War Fears Suddenly Spark $500 Billion Bitcoin And Crypto Price Crash—Hitting Ethereum, BNB, XRP, Solana And Dogecoin, Forbes, accessed on 14 April 2024.
- Chayanika Deka, 50% of Solana’s Recent Token Launches Revealed as Malicious Scams: Report, Cryptopotato, accessed on 14 April 2024.
Share
Related Article


See Assets in This Article
0.0%
0.0%
0.0%
0.0%
0.0%
BTC Price (24 Hours)
Market Capitalization
-
Global Volume (24 Hours)
-
Circulating Supply
-