Market Analysis Aug 14th 2023: US$28,500 becomes the strongest support for Bitcoin

Bitcoin is currently showing stagnant movement, with a modest increase of 1.5% over the past week. Although there is strong resistance at $30,000, BTC appears to be gravitating toward its 100-day moving average at $28,500, which has acted as significant support. While BTC’s dominance had a momentary spike, the overall trend appears to be down. Are there still factors that can push BTC higher? Read more below.
The Pintu trading team has gathered critical information and analyzed the general economic situation and the crypto market’s movements over the past week. However, it should be noted that all information in this Market Analysis is intended for educational purposes, not as financial advice.
Market Analysis Summary
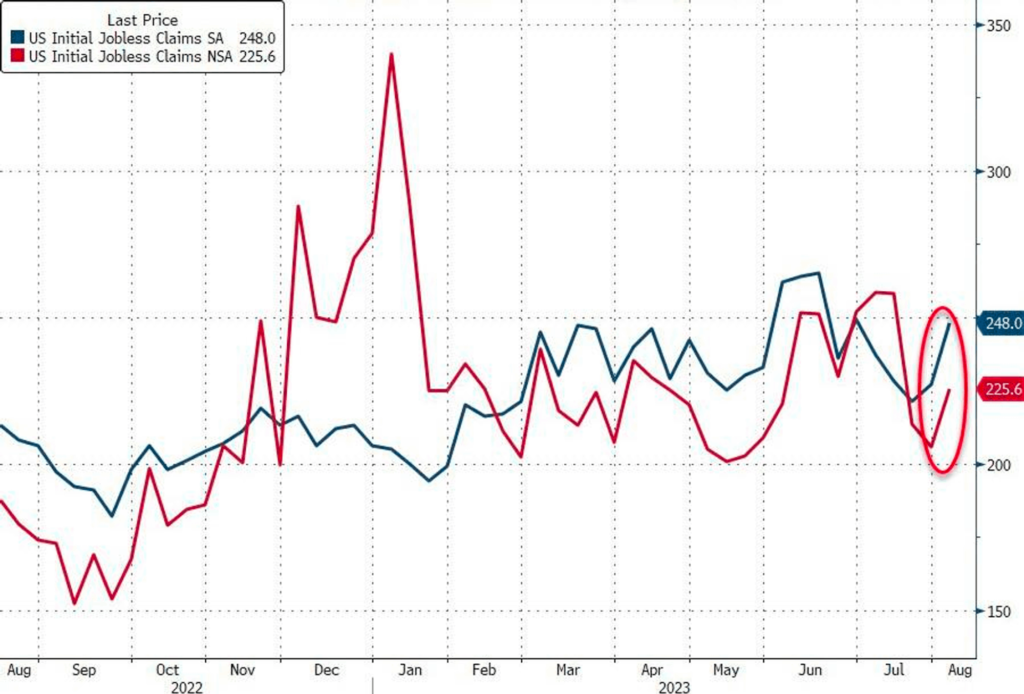
- 📈 Initial unemployment claims in the US reached a one-month peak at 248,000 claims, surpassing economists’ predictions of 230,000 claims. Meanwhile, continuing unemployment claims dropped to 1.68 million, below the expected 1.7 million.
- 🧤 The core consumer price index rose by 0.2% for two consecutive months, providing optimism for the Fed in controlling inflation.
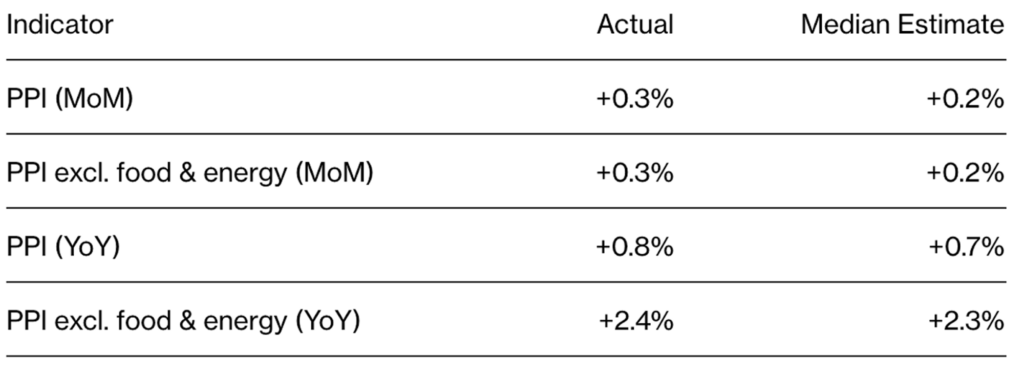
- 💪🏻 US PPI for July showed an increase of 0.3% and rose 2.4% compared to the previous year.
- ✍🏻 BTC rose 1.5% with a psychological threshold at $30,000 and a 100-day moving average at $28,500 as support.
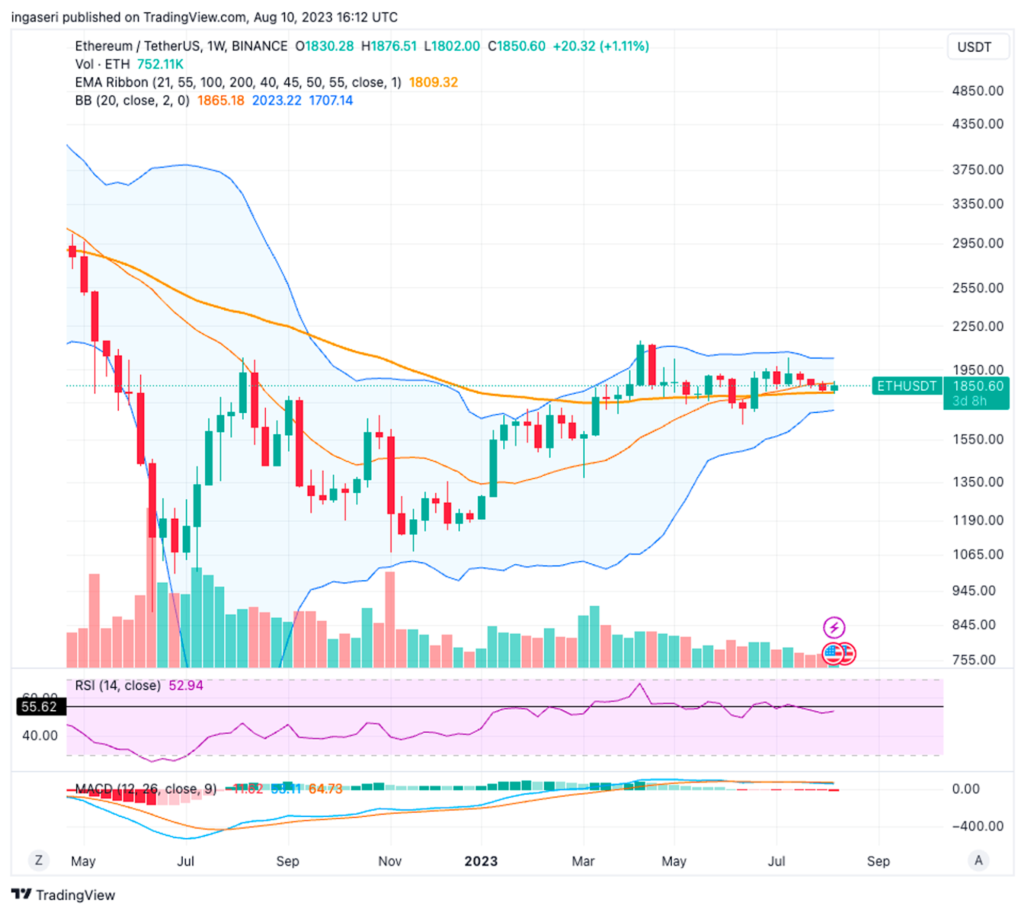
- 🦾 ETH’s strongest support lies in the Exponential Moving Average (EMA) over 55 weeks, with resistance at US$2,000.
Macroeconomic Analysis
This week’s analysis begins with U.S. jobless claims, a proxy for layoffs, hitting a one-month high. Despite the increase, the number of people filing for unemployment benefits remains historically low, indicating the resilience of the labor market in the face of rising interest rates.
Initial jobless claims, which are seasonally adjusted, rose by 227,000 to a total of 248,000, according to Thursday’s report from the U.S. Department of Labor. This is the highest level since the week ending July 1 and exceeds economists’ predictions of 230,000 new claims.
Currently, the four-week average for jobless claims is 231,000, up from the previous reading of 228,250.
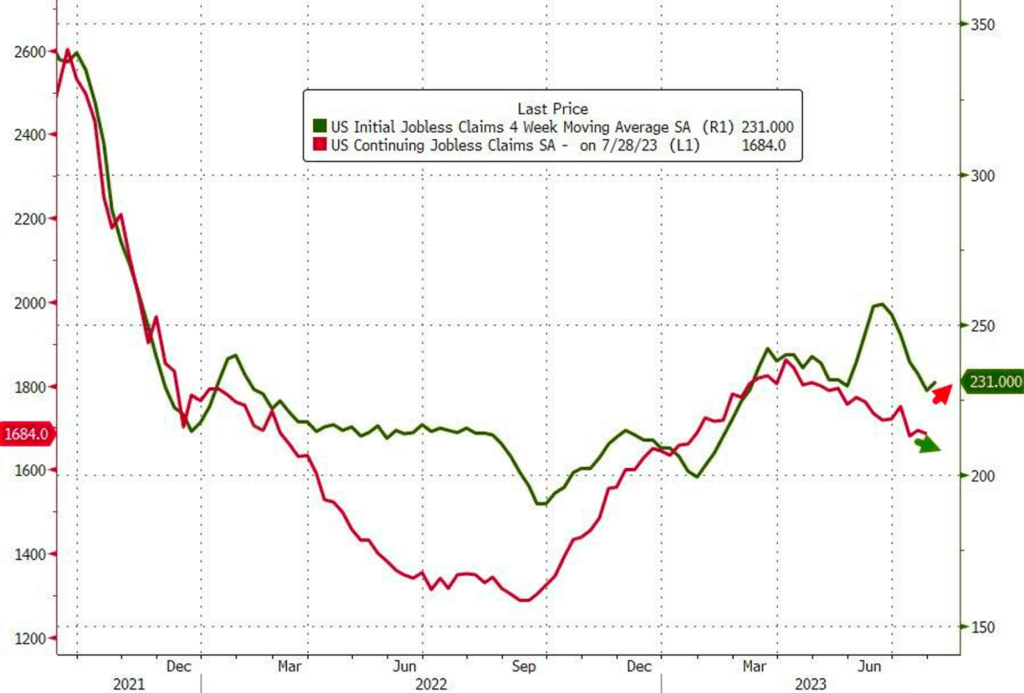
Meanwhile, continuing jobless claims, which measure the number of people receiving unemployment benefits as of July 29, fell to 1.68 million. This was below economists’ expectations of 1.7 million.
In addition to the jobless claims data, the Bureau of Labor Statistics reported that the core consumer price index, which excludes food and energy costs, rose 0.2% for the second month in a row. This increase gives the Federal Reserve optimism that it can control inflation without triggering an economic downturn.
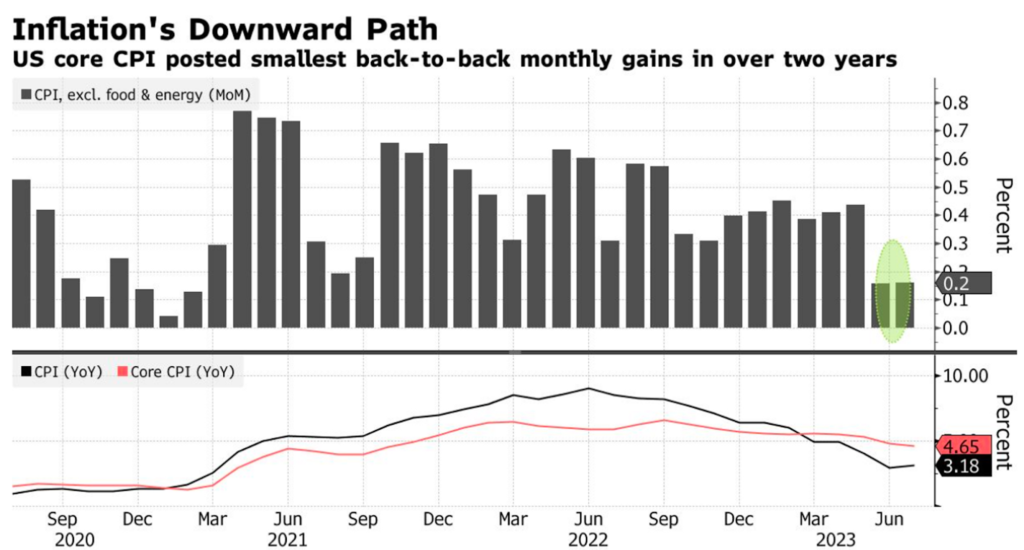
The annual reading of the Consumer Price Index (CPI) showed a slight increase due to less favorable comparisons with the previous year’s index.
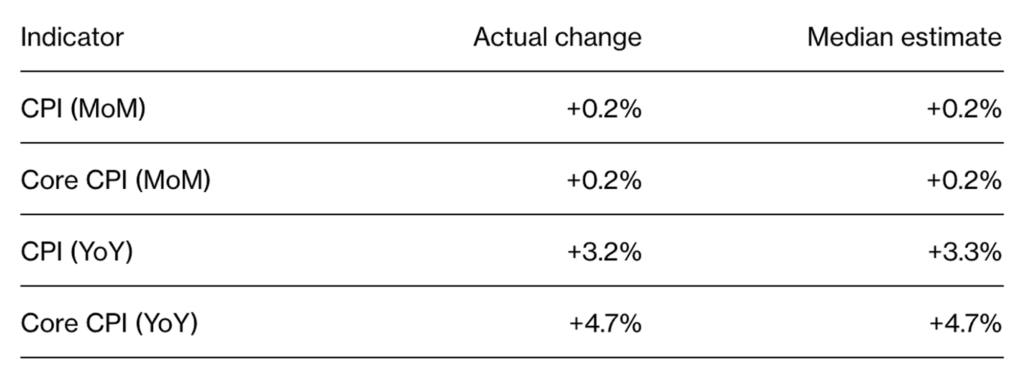
The Consumer Price Index (CPI) rose 3.2% from a year earlier, driven largely by housing costs, which accounted for 90% of the increase in July. In the context of measuring inflation, this increase is considered favorable as the housing component of the CPI tends to reflect changes with a lag.
In addition to the CPI, another metric closely watched by Jerome Powell is the supercore price, which rose for the first time in 2023. This metric excludes energy and housing costs. The takeaway for the Federal Reserve from these various metrics is that inflation is generally moving in a positive direction, although the central bank still has a large amount of data to analyze before the September 19-20 meeting.
Following the release of the CPI and Supercore price reports, the financial markets had a mixed reaction. For example, equity futures were volatile, while the S&P 500 contract briefly hit its session high before retreating to its pre-release level. Even in New York, these contracts were up 0.7%. Meanwhile, the yield on the two-year Treasury note fell about 3 basis points, and the ten-year yield fell more than 2 basis points. The Bloomberg Dollar Spot Index was also down 0.3%.
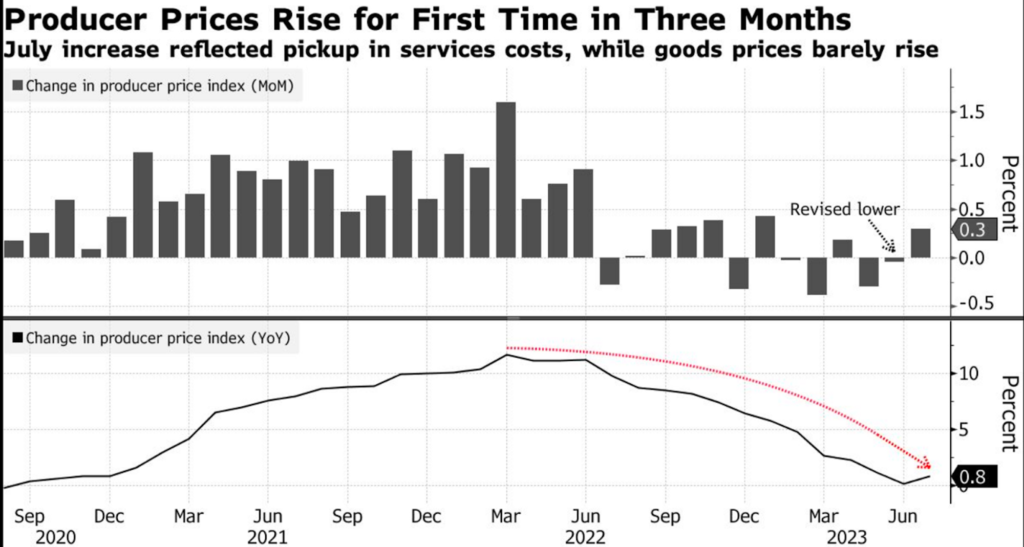
In addition to the CPI, the U.S. Bureau of Labor Statistics reported that the Producer Price Index (PPI) for final demand and the core index, which excludes food and energy, rose 0.3% in July. This shows an increase of 2.4% compared to the same period last year. Another PPI data, excluding trade services, showed a monthly increase of 0.2% and a year-on-year increase of 2.7%.
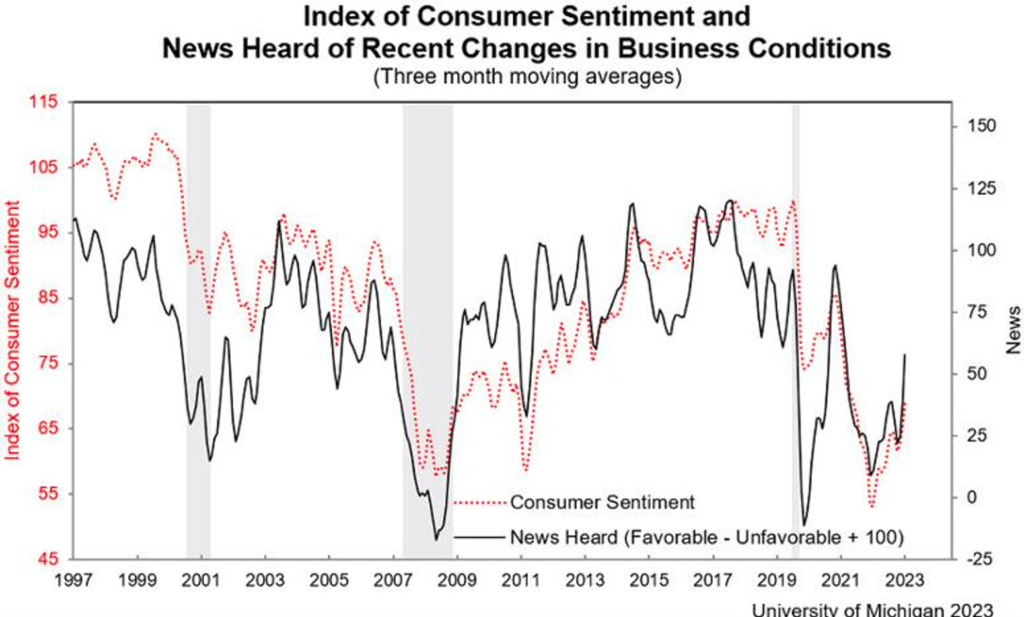
In contrast to the producer index, the University of Michigan’s consumer sentiment index fell to 71.2 in the first half of August from 71.6 in July.
July marked the highest level of sentiment in nearly two years, largely due to easing inflation. However, recent CPI reports, such as Thursday’s, suggest that the sustained period of slowing core inflation may be coming to an end.
BTC & ETH Price Analysis
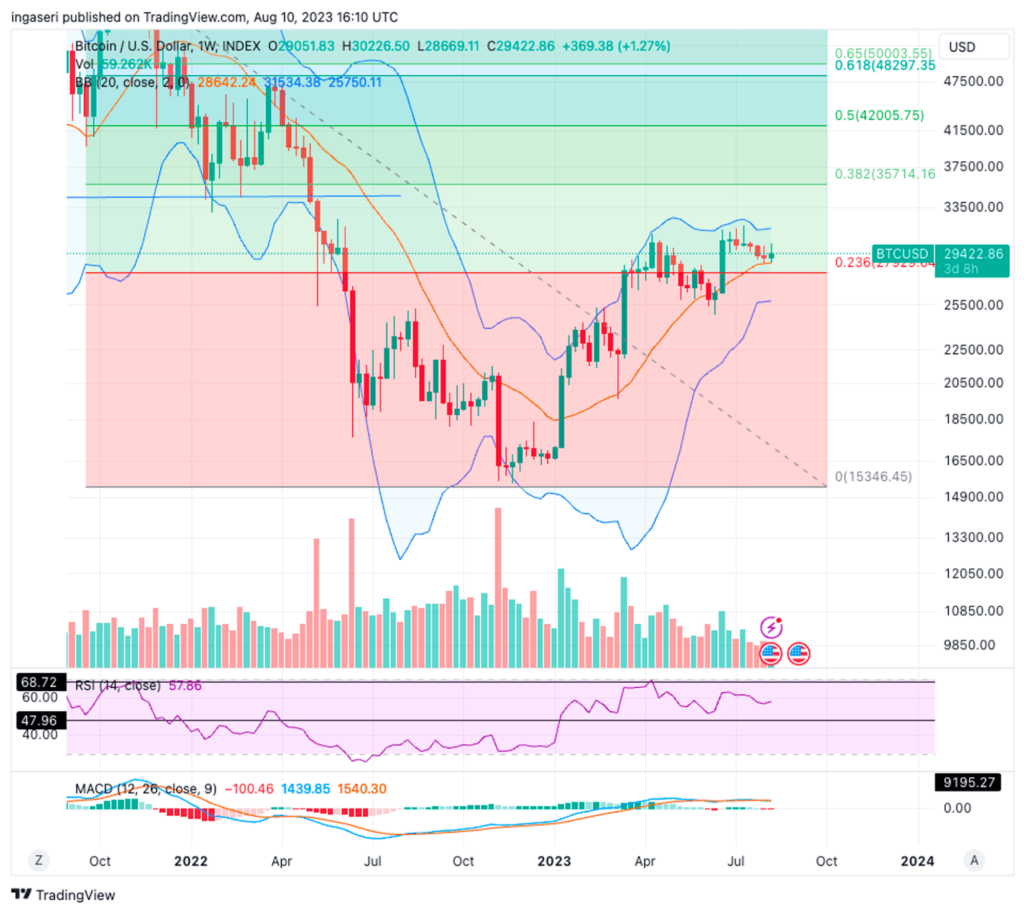
Bitcoin (BTC) continues to trade sideways, up just 1.5% for the week. BTC has a psychological threshold at $30,000, which serves as its strongest resistance level, especially after a previous rejection at this price. The trend is characterized by a gradual decline towards the 100-day moving average, currently at $28,500. This level has proven to be a strong support that has prevented significant declines for an extended period of time.
Just like BTC, ETH saw only a 1% rise last week, with the 55-week EMA acting as its support. ETH is currently facing psychological resistance at $2,000, having previously experienced a decline after being rejected from the $2,000 level.
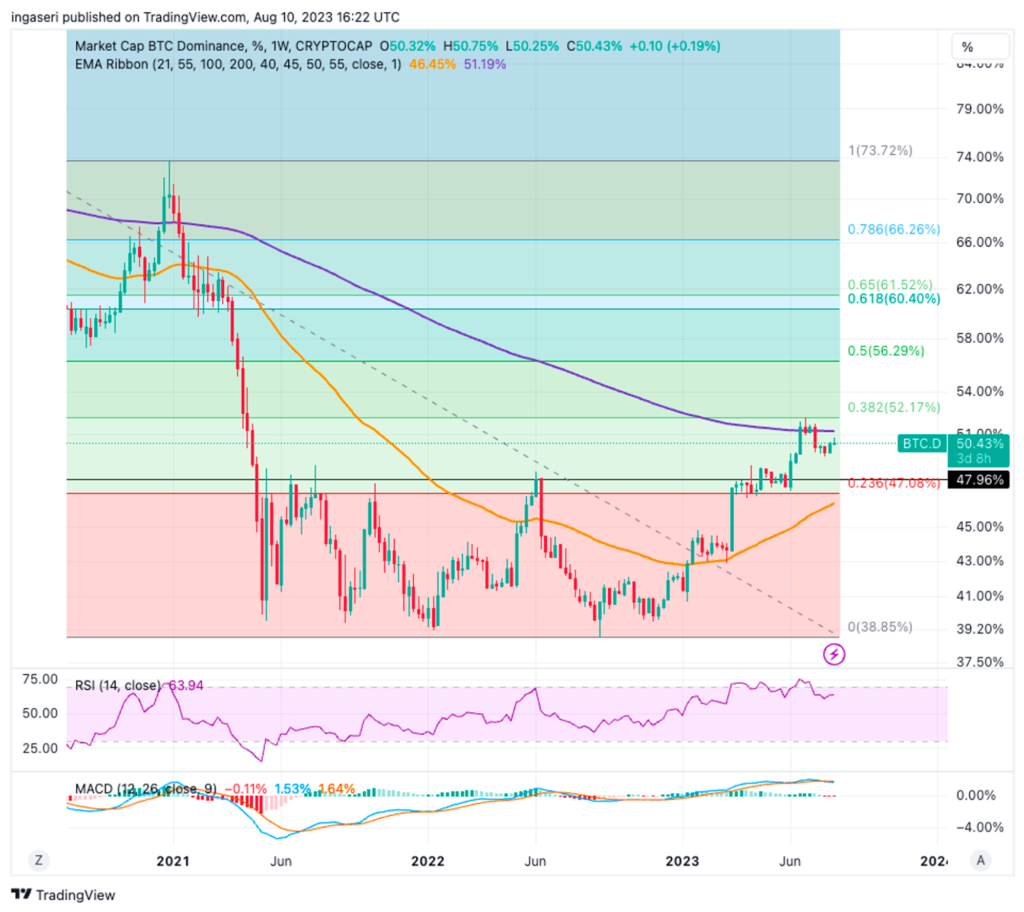
Although BTC’s dominance has increased over the past two weeks, it is currently in a downtrend after hitting resistance at the 0.382 retracement line (52%).
On-Chain Analysis
- 📊 Exchange: As the exchange reserve continues to fall, it indicates lower selling pressure. Net deposits on exchanges are high compared to the 7-day average. Higher deposits can be interpreted as higher selling pressure.
- 💻 Miners: Miners’ are selling holdings in a moderate range compared to its one-year average. Miner’s revenue is in a moderate range, compared to its one-year average.
- 🔗 On-Chain: More investors are selling at a profit. In the middle of a bull market, it can indicate a market top. Long term holders’ movement in the last 7days were lower than the average. They have a motive to hold their coins. Investors are in a anxiety phase where they are currently in a state of moderate unrealized profits.
- 🏦 Derivatives: Long position traders are dominant and are willing to pay to short traders. Selling sentiment is dominant in the derivatives market. More sell orders are filled by takers. As open interest increases, it indicates more liquidity, volatility, and attention are coming into the derivative market. The increasing trend in OI could support the current ongoing price trend.
- 🔀 Technicals: RSI indicates a neutral condition. It indicates a neutral condition where the current price is in a moderate location between the highest-lowest range of the last 2 weeks.
News About Altcoins
- PayPal in partnership with Paxos TrustCo, plans to launch the PayPal USD (PYUSD). An ERC-20 stablecoin backed by U.S. dollar deposits, short-term government bonds and similar cash equivalents, on the Ethereum blockchain. The move follows regulatory challenges faced by the BUSD stablecoin, jointly launched by Paxos and Binance, which was suspended from issuance by the State of New York in February and later deemed a security by the SEC in a June lawsuit against Binance. PYUSD, which is expected to launch soon, will allow transfers between PayPal and compatible external wallets, as well as the conversion of cryptocurrencies within PayPal into PYUSD. A planned collaboration with FTX to debut the coin on Solana was scrapped due to FTX’s bankruptcy.
- On August 7, an incident on Curve resulted in the theft of approximately $73.5 million in cryptocurrency from Ethereum. Since then, approximately 73% ($52.3 million) has been returned, with $19.7 million still outstanding. AlchemixFi returned $22 million, Jpegd returned nearly $11.5 million, c0ffeebabe.eth returned $7 million, and Alchemix’s white hat operation returned $13 million.
News from the Crypto World in the Past Week
- The U.S. Securities and Exchange Commission (SEC) plans to appeal certain rulings in the Ripple Labs case to the Southern District of New York. This follows a recent case involving Terraform Labs in which a judge disagreed with the approach taken by Judge Torres in the Ripple case. Torres had previously ruled that certain XRP sales by Ripple using a blind bidding process didn’t constitute securities violations, while other direct sales to institutions did.
- DeBank has unveiled the testnet for its DeBank Chain, developed using the OP Stack. With plans to roll out the mainnet by 2024, the DeBank Chain is designed to reduce gas fees, provide a similar experience to account abstraction, and ensure the protection of Layer 1 assets.
Cryptocurrencies Market Price Over the Past Week
Cryptocurrencies With the Best Performance
- THORChain (Rune) +19.72%
- ApeCoin +10.41%
- Hedera Hashgraph +8.32%
- Basic Attention Token +8.06%
Cryptocurrencies With the Worst Performance
- GMX (GMX) -12.86%
- Mantle (MNT) -9.72%
- Optimism (OP) -8.15%
- Curve Finance -5.25%
References
- Cheyenne DeVon, PayPal is diving deeper into crypto by launching its own stablecoin—what investors should know, Cnbc, accessed on 12 Agustus 2023.
- Sarah Wynn, SEC says it will appeal partial defeat in case against Ripple Labs, Theblock, accessed on 12 Agustus 2023.
- Peckshieldalert, #PeckShieldAlert A total of ~$73.5M worth of cryptos on #Ethereum were stolen, Twitter, diakses pada 12 Agustus 2023.
- DeBankDeFi, We’re excited to announce DeBank Chain, aiming to become the Asset Layer for Social!, Twitter, diakses pada 12 Agustus 2023.
Share
Table of contents
Related Article


See Assets in This Article
BTC Price (24 Hours)
Market Capitalization
-
Global Volume (24 Hours)
-
Circulating Supply
-