Market Analysis March 30, 2026: Bitcoin Crashes Again!

Correction Continues Amid Geopolitical Tensions
The crypto market experienced correction pressure throughout last week (March 23-29, 2026). The total market cap moved in the range of $2.3T-$2.52T, with the Fear & Greed Index sentiment being in the “Fear” zone (around 27).
Bitcoin , which still dominates the market, failed to hold above $70,000, while Ethereum and Solana showed weaker price movements. The main factors: the US-Israel-Iran war tensions that triggered a surge in oil prices, the unexpected weakness in gold, and the lingering effects of the previous FOMC hawkishness as well as the expiry of options that occurred at the end of March.
Selling pressure dominated throughout the week. BTC was repeatedly pushed back to the $66,000-$68,000 area and closed around $66,500-$66,620 on March 29 (a weekly decline of around 4-7% from the weekly opening). ETH fell to the $1,980-$2,004 range, while SOL weakened to $81.34. Other major altcoins (XRP and BNB) were also down 5-8%. Trading volumes remain high ($50-60 billion/day), but sentiment is more defensive.
Iran war that increased oil prices >$100-105/barrel. As of writing this report, oil prices are at $109 per barrel. However, the crypto market is showing relative resilience compared to stocks and gold, although there are no new bullish catalysts for an altseason or bounce back.
How Iran War Affects Gold and Crypto Prices
The US-Israel-Iran conflict that has continued since late February has been the main driver of volatility. Oil prices jumped more than 50% in a month, natural gas has risen more than 60% in 2026. This triggered inflation fears and many investors took a risk-off stance on risky assets.
Gold (which is usually considered a safe haven) has actually fallen sharply by 10-19% since the outbreak of the conflict. Spot gold fell from a peak of ~$5,600/oz to ~$4,200-$4,530/oz. The reason: the US dollar strengthened, Treasury rates rose, and expectations of more hawkish Fed rates invalidated the “flight to safety” narrative.
Cryptos reacted more dynamically. Although BTC fell during the initial attack, the crypto market later showed that it was more resilient with fewer declines than gold or US stocks. Basically, traders utilized the 24/7 liquidity of crypto for hedging. But overall, BTC/ETH/SOL still experienced a sell-off alongside stocks as risk appetite declined.
Technical Analysis of Bitcoin and Ethereum
Bitcoin
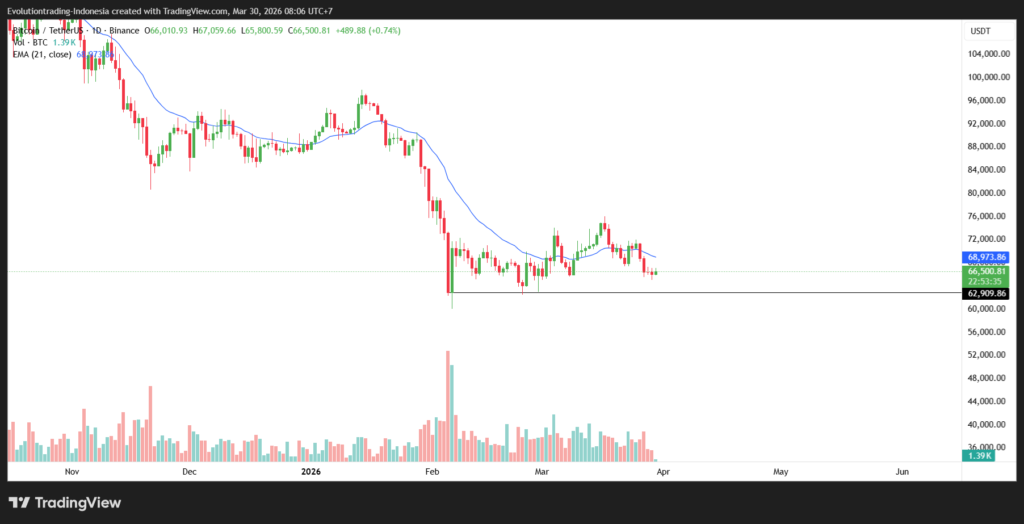
Bitcoin has experienced a significant decline since mid-March 2026 and is currently at its support area of around $66,000. This level is important for Bitcoin, because if Bitcoin cannot hold this level, the downside potential for Bitcoin will be quite significant, with some analysts predicting Bitcoin could reach $50,000.
The bearish sentiment is also reinforced as Bitcoin is currently below the 21 EMA on its 1-day timeframe.
Ethereum
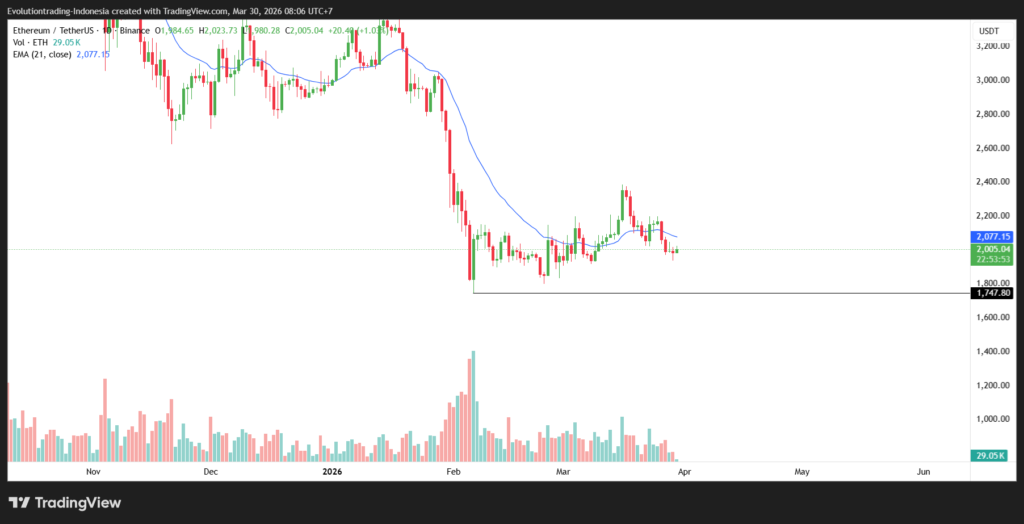
Technically, Ethereum has a similar structure to Bitcoin, which is bearish. This is because Ethereum has formed a lower high and is below the 21 EMA of its 1-day timeframe. Both are bearish signals.
The $1,750 level is an important level for Etherum as support.
Macroeconomic Calendar (March 30 – April 5, 2026).
This week the focus is on US and European macro data(Good Friday on April 3 sees stock markets closed in many countries). Key catalysts:
- Monday March 30: German CPI (prelim), Fed Chair Powell speaks, Dallas Fed Manufacturing Index.
- Tuesday, March 31: US ADP Employment, ISM Manufacturing PMI.
- Wednesday April 1: US Retail Sales, ISM Services PMI, China Caixin Manufacturing PMI.
- Thursday April 2: Switzerland CPI, Australia Trade Balance.
- Friday April 3 (Good Friday): March US Non-Farm Payrolls , US Services PMI, China Caixin Services PMI.
US employment data (NFP) is the most crucial event. Expectations are ~45,000-60,000 new jobs. Stronger-than-expected data could strengthen USD and pressure crypto; weak data could open the door to an early Fed rate cut. There is no FOMC meeting this week (next one is April 28-29).
On-Chain Analysis, Flow ETFs, and More
- BTC ETF: Inflows were strong throughout March (totaled ~$1.3-1.47 billion in early-mid month, including a 4-week positive streak). BlackRock IBIT and Fidelity FBTC were dominant. However, the end of the week (March 26) saw outflows of ~$171 million. Overall, ETFs continue to provide a “structural floor” and absorb more BTC than they mine.
- On-chain BTC: 57% supply in-profit (weak), small retail wallets aggressive accumulation while whales neutral. 365-day MVRV still negative → historical accumulation zone.
- SOL ETF: Consistent positive inflows ($17-22m/day across multiple sessions), totaling close to $1bn since launch. Solana’s on-chain remains strong (15 million+ transactions).
- ETH ETF: Neutral, good monthly inflow but price has not gone up.
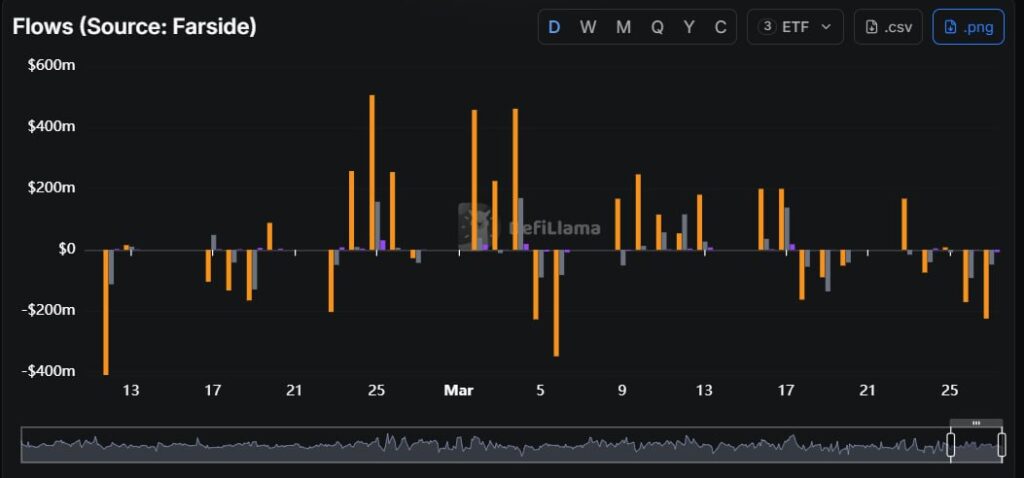
ETF data. Source: DefiLlama
Conclusion
This week’s conclusion: the market is looking for direction amid geopolitical and macro uncertainties. Institutions via ETFs have been the main support, while retail has been on the defensive. Next week, the US NFP data will determine whether the correction continues or there is a technical rebound. Traders are advised to focus on key support levels and manage risk tightly.
Share
Related Article


See Assets in This Article
1.5%
0.0%
0.0%
0.0%
BTC Price (24 Hours)
Market Capitalization
-
Global Volume (24 Hours)
-
Circulating Supply
-