Market Analysis March 9, 2026: BTC Consolidates Amid Tug-of-War over Institutional Accumulation and Geopolitical Tensions

Entering the second week of March 2026, the crypto market is showing strong “push-pull” dynamics. On the one hand, cash inflows from institutions through ETFs reached fantastic figures, but on the other hand, geopolitical tensions and looming inflation data put retail investors on the defensive.
Article Summary
- Bitcoin Holding Above $60,000: BTC price is currently stuck in a consolidation range of $62,510 to $74,050.
- Ethereum Still Waiting for a Catalyst: ETH is moving within a narrow area of $1,747 to $2,152. Ethereum ETF fund flows this week were minimal at $23.5 million, well below BTC.
- Solana Under Pressure of Slowing On-Chain Activity: SOL consolidates in the range of $76.60 to $89.20 with downside risk to $67.50 if the support fails to hold.
- Institutional Accumulation: The Spot Bitcoin ETF recorded a net inflow of $1.47 billion in the past two weeks, with BlackRock accumulating over 21,000 BTC.
1. Crypto Market Analysis March 9, 2026
Overall, the crypto market showed quite unique dynamics this week. While Bitcoin’s price has been relatively stable at a high level, the market’s psychological indicators have been moving in the opposite direction. This phenomenon creates a “tug-of-war” between two major forces: selling pressure from retail investors responding to global uncertainty, and institutional buying power that continues to accumulate positions at current prices.
Bitcoin (BTC) Analysis
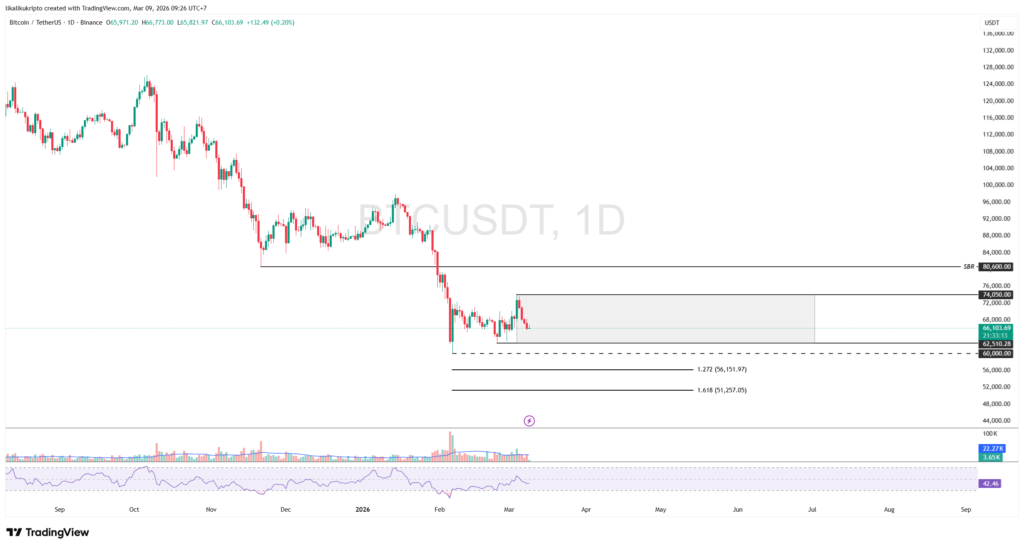
Analysis: Bitcoin is stuck in the $62,510 – $74,050 range. BTC is currently testing the strength of psychological support. If ETF flows slow down and global tensions heat up, a retest to $60,000 is highly likely. However, technically, as long as BTC holds above $60,000, the medium-term bullish structure is maintained with a target of $80,600.
Ethereum (ETH) Analysis
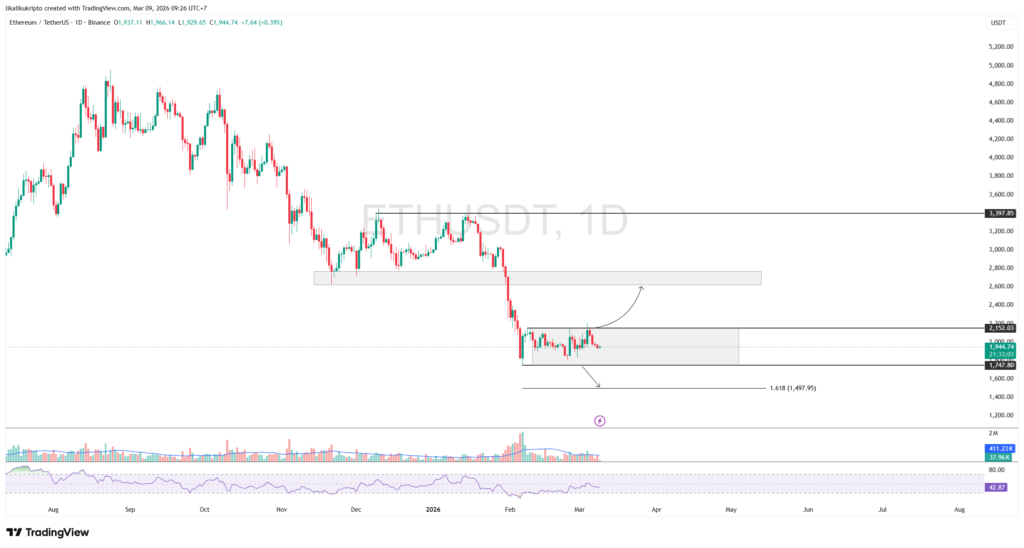
Analysis: ETH is moving in the range of $1,747 – $2,152. Unlike BTC, the Ethereum ETF has only recorded small inflows of around $23.5 Million this week. ETH needs a volume boost to break the $2,152 zone to chase SBR’s target of $2,623.
Solana Analysis (SOL)
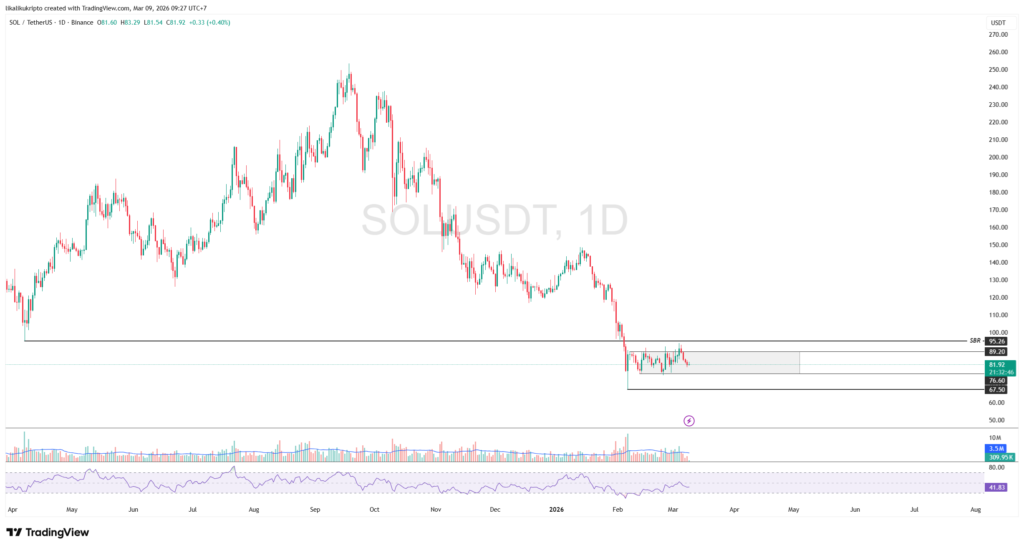
Analysis: SOL is stuck in the range of $76.60 – $89.20. Decreased on-chain activity in the meme coin ecosystem this week has SOL moving sideways. The downside target if this area is broken is $67.50 (February Low).
2. Market Sentiment: Domination of “Extreme Fear”
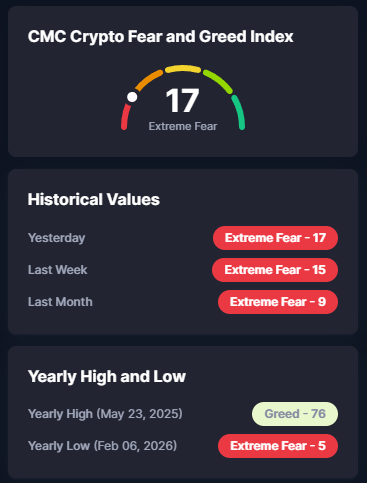
Although Bitcoin price has been relatively stable in the high area, the Crypto Fear & Greed Index fell sharply to level 18 (Extreme Fear) at the end of this week.
- Cause: The drop from 25 (Fear) to 18 was triggered by rising tensions in the Middle East (US-Israel-Iran) which eroded investors’ risk appetite.
An interesting point to note is that historically, Extreme Fear conditions that occur alongside consolidating prices often signal potential for long-term investors. This pattern is known as contrarian buying, where market participants with longer time frames take advantage of this moment of fear to accumulate assets.
3. ETF Cash Flow: BlackRock Leads the Accumulation Wave
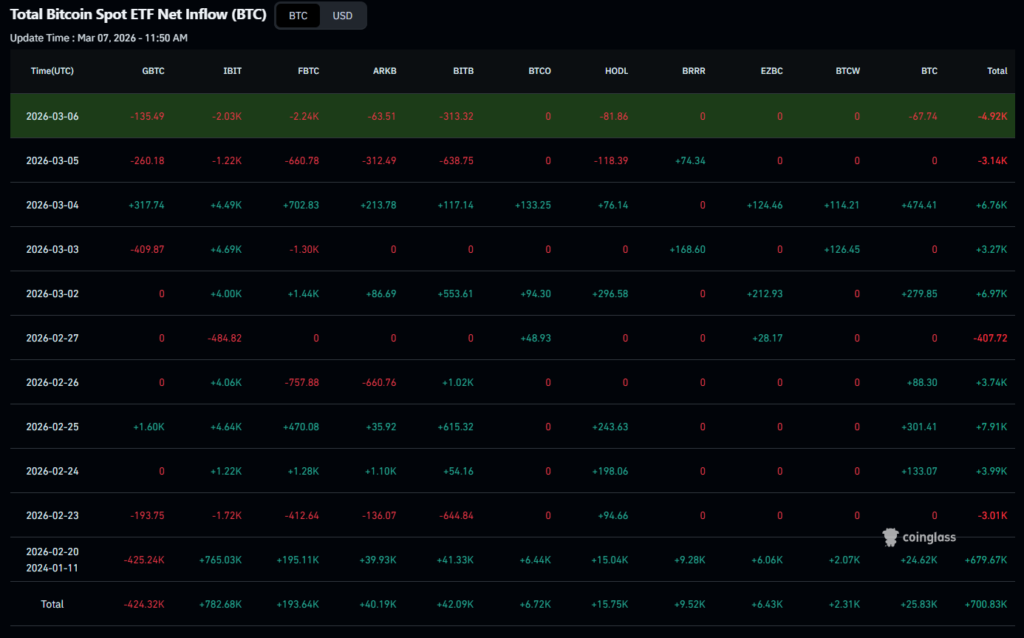
On-chain data shows an interesting contrast to the fearful sentiment in the retail market. Net inflows into Spot Bitcoin ETFs in the US were volatile again:
| Indicator | Latest Data (This Week) |
|---|---|
| Total Net Inflow (Last 2 Weeks) | $1.47 Billion |
| IBIT (BlackRock) Domination | Accumulated 21,814 BTC since the end of February |
| Highest Daily Volume | $461 Million (Recorded on March 4, 2026) |
The massive accumulation by BlackRock and Fidelity shows that institutions see the $60,000 – $65,000 area as a value zone worthy of long-term accumulation.
4. Global News Highlights: Wall Street & Regulation
- Wall Street Expansion: The parent company of NYSE (ICE) is reportedly exploring a $25 Billion deal with crypto exchange OKX. This signals the deepening integration of traditional and crypto capital markets.
- Europe & Asia: The implementation of the crypto tax reporting framework (CARF) comes into effect as of March 1, 2026, forcing global exchanges to be more transparent.
5. Watchlist: Next Week’s Macro Agenda
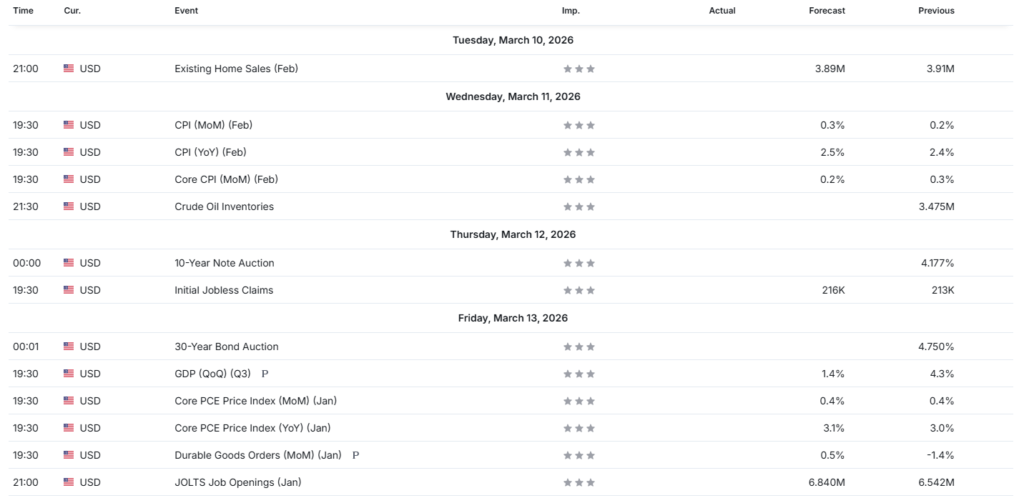
Please be aware of high volatility on the following dates:
- March 11, 2026: US CPI (Inflation) data release. If inflation is higher than expected, selling pressure on risky assets will increase.
- March 13, 2026: US JOLTS (Job Vacancies) data which will determine the direction of the Fed’s interest rate policy at its March 18 meeting.
Conclusion
The crypto market this week was driven by two major opposing forces. Fear of geopolitical escalation suppressed sentiment and prices, while massive accumulation by institutions through ETFs kept the correction from deepening. For investors, the key watch this week is Bitcoin’s weekly price close above $62,500. As long as that level can be maintained, the medium-term bullish momentum still has the potential to continue. Conversely, failure to hold the area along with disappointing inflation data could open the door to a more significant correction.
Disclaimer: This article was created by Volubit. All information presented in this article has been prepared for general educational and informational purposes. This content is not intended as investment advice, recommendations, solicitation to buy or sell certain crypto assets, nor the basis for financial decision making. Any investment decision is entirely the responsibility of the reader, taking into account their financial condition, investment objectives, and risk tolerance.
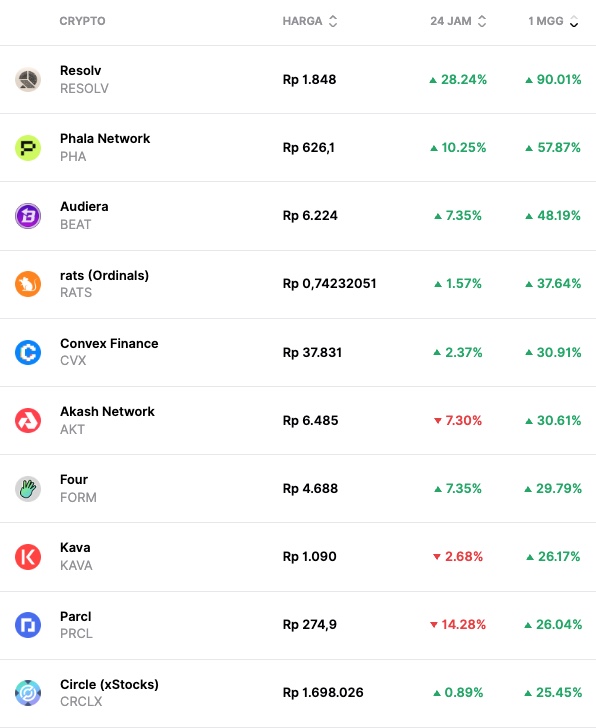
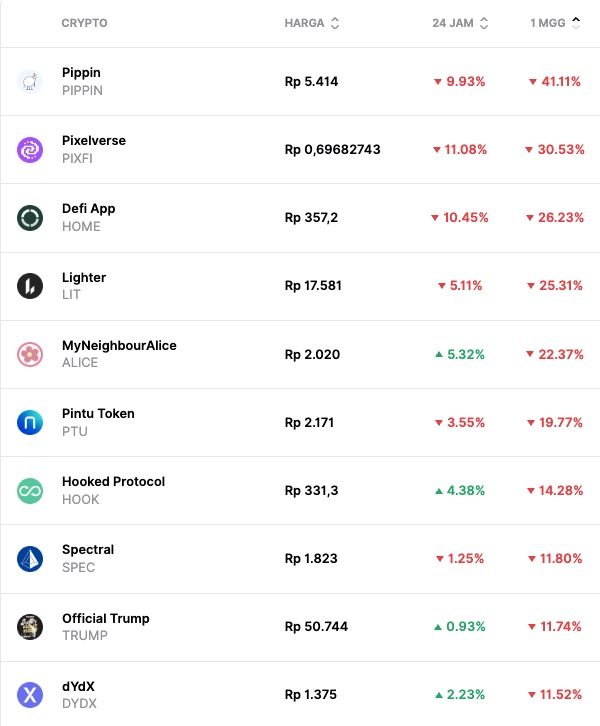
Weekly Winners and Losers
Share