Market Analysis October 3-9: US Employment Data Released, US Stock Market Tumbles and Bull Flag on BTC Daily Chart

The US stock market tumbles after the release of the latest employment data by the US Bureau of Labor Statistics last week. Meanwhile, a bull flag pattern is seen on the daily chart of BTC.
Pintu’s trader team has collected various important data about the movement of the crypto market over the past week which is summarized in this Market Analysis. However, you should note that all information in this Market Analysis is for educational purposes, not financial advice.
block-heading joli-heading" id="market-analysis-summary">Market Analysis Summary
- 📊Total non-farm payroll employment increased by 263,000, and unemployment rate edged down to 3.5 percent in September.
- 📉U.S. equities market tumbled upon the data release. This is because the steps taken by the US policy makers to slowdown inflation are considered ineffective.
- 🔎 Meanwhile, a bull flag pattern is seen on the daily chart of BTC, which means there is a potential for a price increase in the short term. However, on the chart with the longer period, a descending pattern appears, which means a possible decline in the price in the longer term.
Macroeconomic Analysis
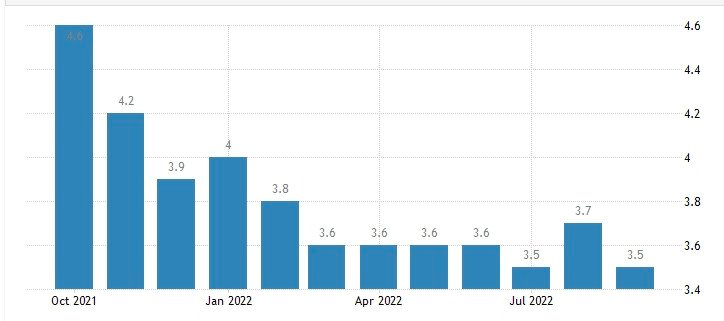
Total non-farm payroll employment increased by 263,000 in September, and the unemployment rate edged down to 3.5 percent, the U.S. Bureau of Labor Statistics reported today. Notable job gains occurred in leisure and hospitality and in health care. Although hiring momentum in this sector continues post pandemic, employment in leisure and hospitality remains at 1.1 million, or 6.7% below the pre-COVID level.
Chart for US NFP:
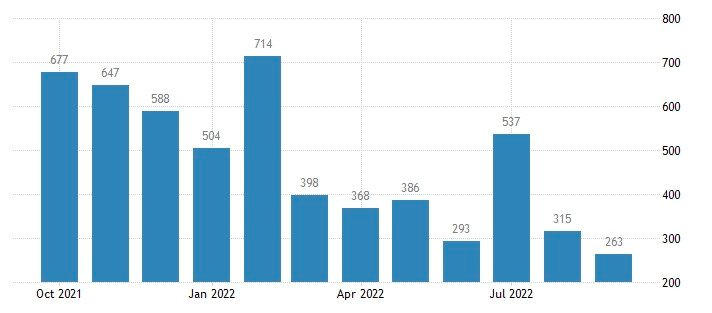
Chart for US Unemployment rate:
These are the statistics that was released:
- Non-farm payrolls: +263,000 vs. +255,000 expected
- Unemployment rate: 3.5% vs. 3.7% expected
- Average hourly earnings, month-over-month: +0.3% vs. +0.3% expected
- Average hourly earnings, year-over-year: +5.0% vs. +5.0% expected
When the non farm payroll report are positive (lower unemployment and higher wages), inflation is generally increased and policy makers tend to lean towards a contractionary monetary policy.
When it is negative (higher unemployment and lower wages), inflation is generally decreased and policy makers tend to lean towards an expansionary monetary policy.
So, any sign of higher unemployment and lower wages and decrease in jobs would mean that their recent measures are effective, however this is not the case as employment is still rising.
Hence upon the data release, U.S. equities market tumbled. The market were down at the start of trading Friday as it weighed the government’s monthly employment report, which showed a slowdown in September hiring but still-robust labor market.
USD is expected to further rise with market turning negative.
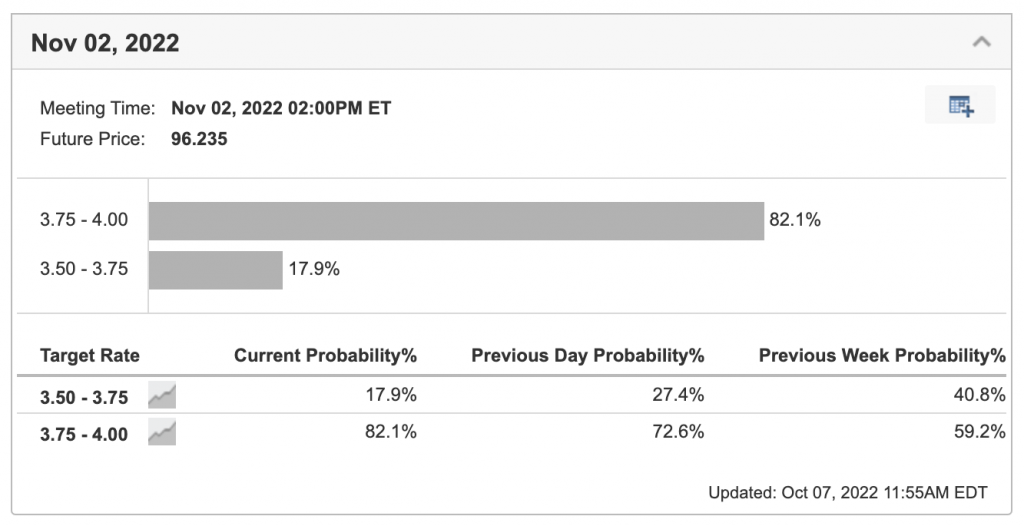
FOMC said that they anticipate the unemployment rate will climb to 4.4% in 2023 and remain at that level for the foreseeable future before declining to 4%. To keep up the momentum of its rate hikes, the Fed is largely expected to implement another 0.75 percentage point increase in rates in November.
Chart for Fed Fund rate:
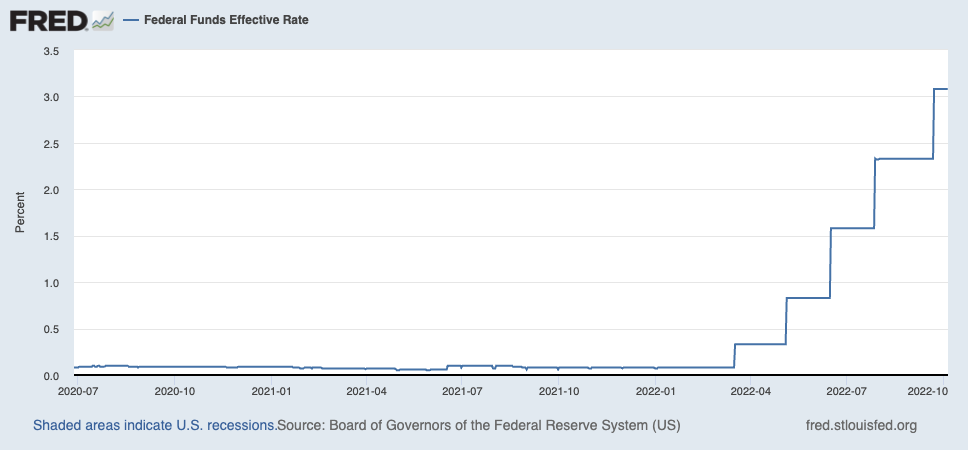
The markets have priced in an 82% chance of a three-quarter point shift in response to the employment data, and they anticipate another half-point increase in December, bringing the federal funds rate to a range of 4.25%–4.5%.
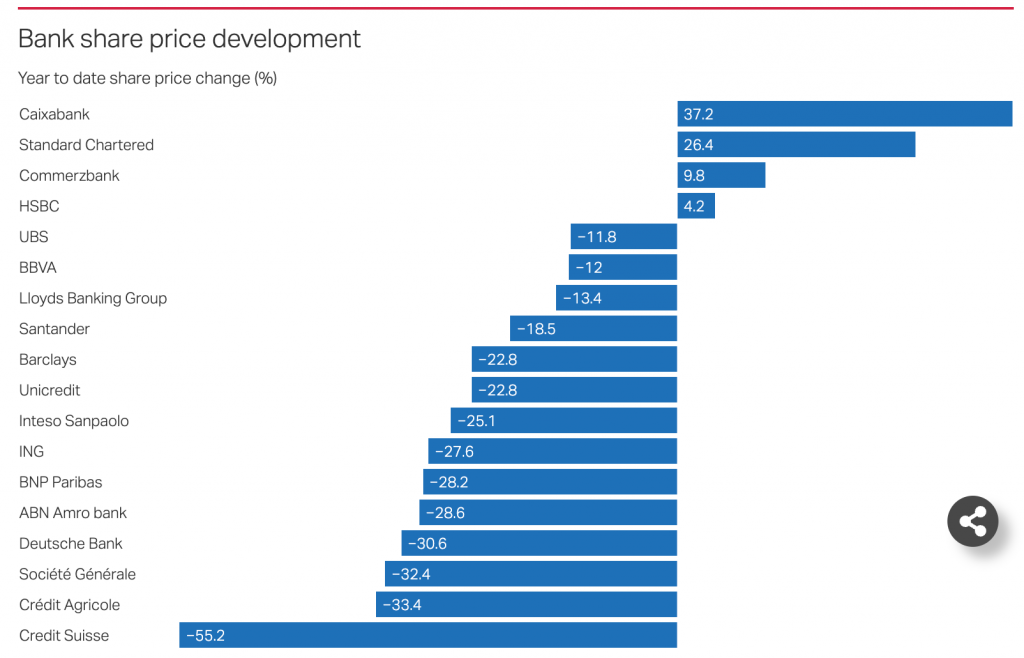
Last week, what’s interesting is that there is a FUD going around that the 2nd largest bank in Swiss, Credit Suisse is under serious pressure. The bank’s CDS (Credit Default Swaps) are currently seeing much demands. It’s five-year CDS soared by more than 100 basis points on Monday. The bank has spent the past few days battling rumors about the strength of its balance sheet.
The bank’s shares tumbled to historic lows of below CHF3.60, down close to 10% when the market opened. There are talks that the group is considering splitting its advisory and investment banking businesses.
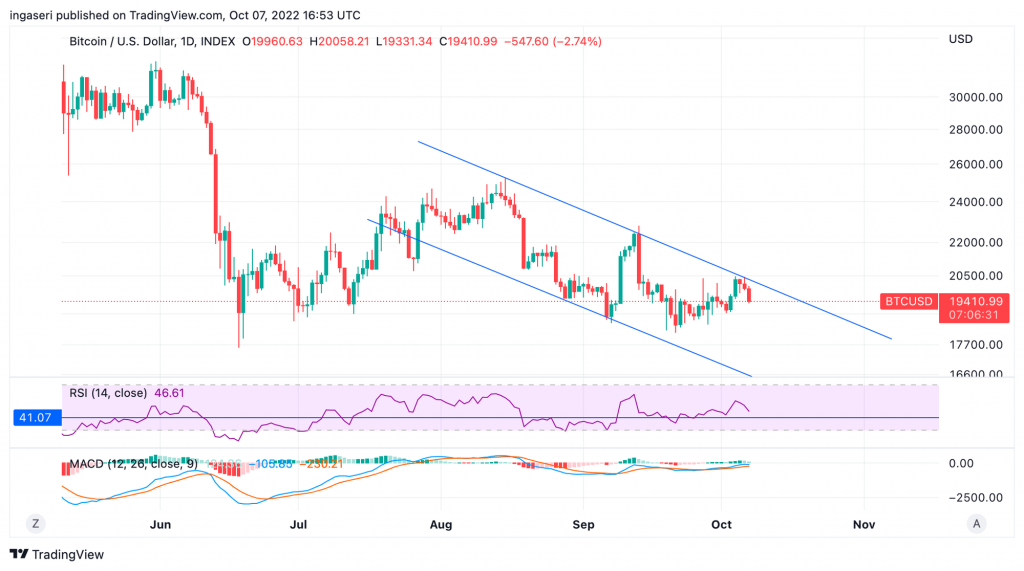
BTC Price Analysis
On BTC daily chart, there’s this bull flag pattern forming. When we do break out, expect the resulting price action to be bullish short term. Given the market condition at the moment, this will be short-lived. Longer term, BTC is range bound at US$19.000-21.000. We are still not expecting to see much price momentum from BTC until early November when Fed is expected to announce the Fed Fund rate hike.
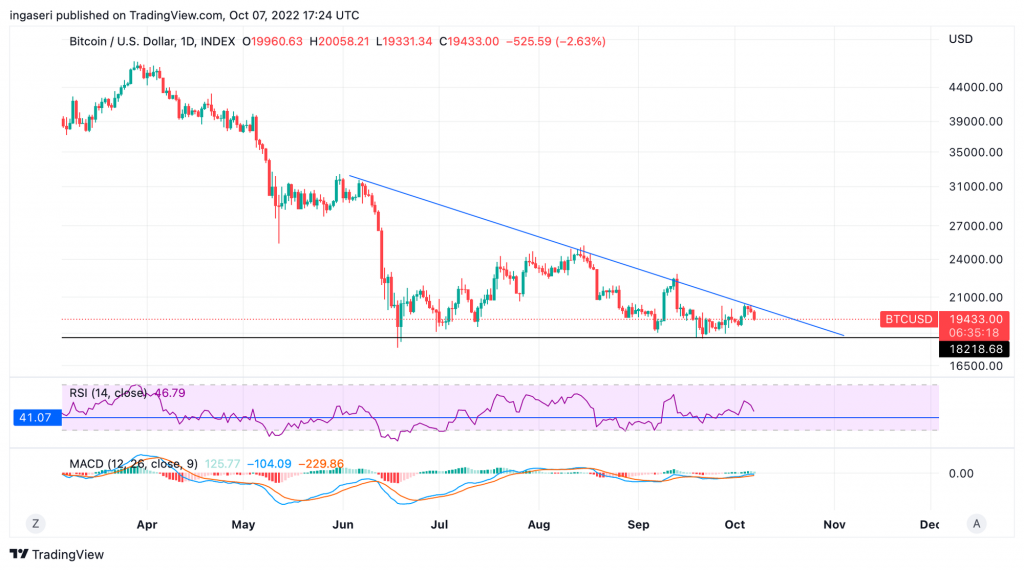
On the larger pattern, we can see a descending pattern formation and notice that we have resistance line of the pattern. This pattern is usually associated with a breakdown and reinforces the possibility that the current support level will be lost in the near future.
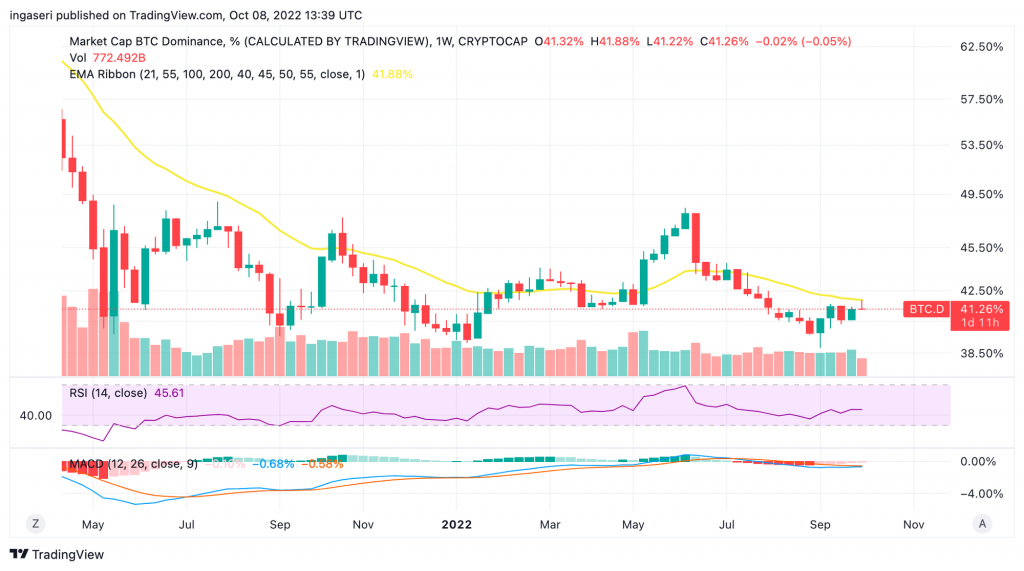
Taking a look at BTC dominance, we have reached the 21 weeks EMA resistance. Expect BTC to further dominate the crypto market over the coming weeks.
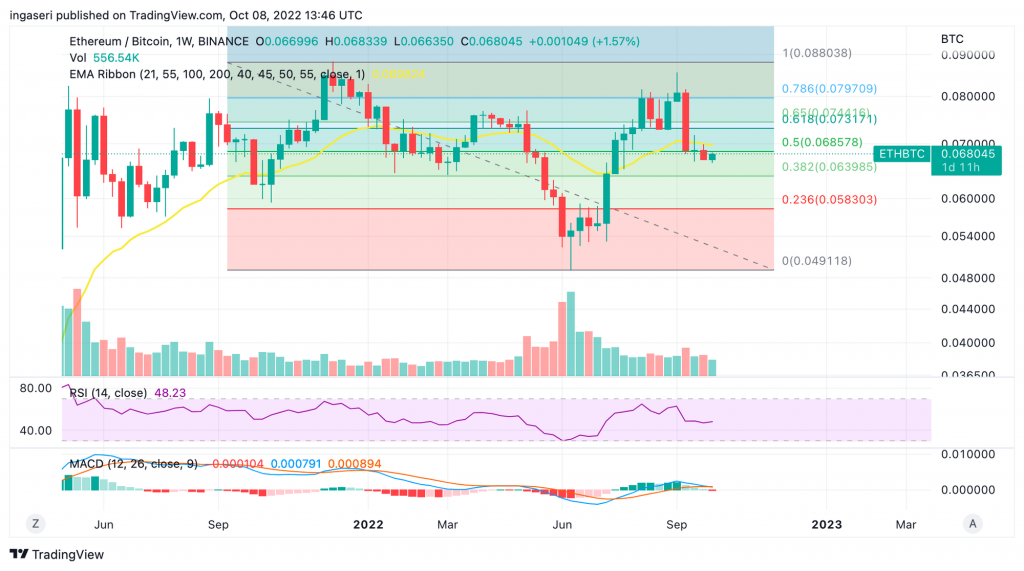
ETH/BTC chart is also turning 0.068 Fibonacci retracement line into a resistance. Should we close the candle below the line and confirm the line as a resistance, we should see BTC move positively against ETH.
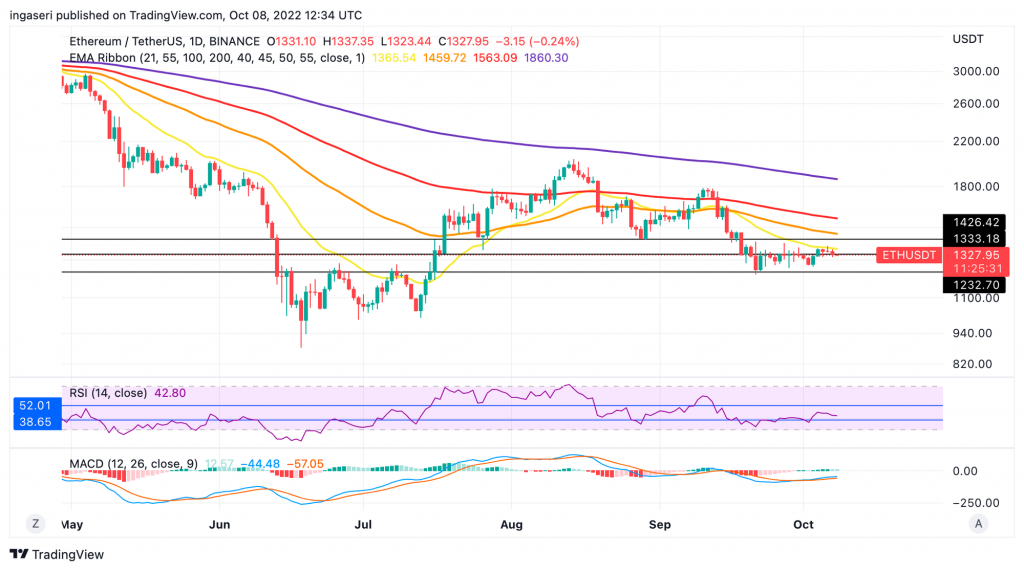
ETH Price Analysis
ETH has been range bound as well for the past week, hovering at US$1,225-US$1,425 price point. Should we turn 1,425 key level into support, ETH would move higher and target US$1,700 next. This consolidation above US$1,225 is bullish and may lead to another significant rally once completed.
On-Chain Analysis
- 📊 Exchange: As the exchange reserve continues to fall, it indicates lower selling pressure. Net deposits on exchanges are high compared to the 7-day average. Higher deposits can be interpreted as higher selling pressure.
- 👨🏻💻 Miners: Miners’ are selling holdings in a moderate range compared to its one-year average. Miner’s revenue is in a moderate range, compared to its one-year average.
- 🔗 On-chain: More investors are selling at a loss. In the middle of a bear market, it can indicate a market bottom. Long term holders’ movement in the last 7days were lower than the average. They have a motive to hold their coins. Investors are in a capitulation phase where they are currently facing unrealized losses. It indicates the decreasing motive to realize loss which leads to a decrease in sell pressure.
- 🏦Derivatives: Long position traders are dominant and are willing to pay to short traders. Selling sentiment is dominant in the derivatives market. More sell orders are filled by takers. As open interest increases, it indicates more liquidity, volatility, and attention are coming into the derivative market. The increasing trend in open interest could support the current ongoing price trend.
Altcoins News
- ⚠️ Binance Smart Chain Hacked. Hackers have stolen $570 million from Binance Smart Chain. Binance, which is one of the largest crypto exchanges, had to temporarily suspend operations of the Binance Smart Chain after the hack. The price of Binance Coin has fallen by 3.5% in the 24 hours since the news of the hack last week.
- ⛓ THORChain Integrates with Avalanche. Last week, THORChain, which has a market cap of $487 million, announced its integration with Avalanche. This integration brings the total number of Layer 1 chains partnered with THORChain to eight, including Bitcoin, Ethereum, Binance Beacon Chain, and Cosmos Hub.
More News on Crypto
- 🐱 Animoca Brands Announce Strategic Investment in Cool Cats. Cool Cats, a popular collection of 9,999 NFT cat-themed profile pictures, received strategic investment from Animoca Brands, which has been focusing on digital property development and the Metaverse. Animoca Brands’ portfolio includes stakes in Axie Infinity, OpenSea, Dapper Labs (NBA Top Shot), Yield Guild Games, Harmony and Star Atlas.
- 🔎 Celcius Reveal User Data in Court Documents. Celsius is back in the spotlight after disclosing the names and financial actions of its users in freely accessible public court documents. The document contains more than 14,500 pages covering the financial transactions of co-founders Alex Mashinsky, Dan Leon and Nuke Goldstein. However, the document also lists the customer’s name, transaction date, account type, which crypto assets and how much was involved.
Share
Related Article


See Assets in This Article
BNB Price (24 Hours)
Market Capitalization
-
Global Volume (24 Hours)
-
Circulating Supply
-