Downward Pressure and Death Cross Threat: Mantra’s Latest Analysis (OM)

Jakarta, Pintu News – In the past 30 days, the price of Mantra has dropped by 20%, including the latest 5% daily decline. Despite the significant correction, the token still ranks as the second largest real-world asset (RWA) based crypto asset. However, recent technical analysis points to a potential trend reversal in a bearish direction, especially with indicators starting to show weakness and an approaching death cross pattern formation.
ADX Indicator Shows Weakening of Consolidation Trend

Mantra’s Average Directional Index (ADX) indicator currently stands at 22.96, down from 26.5 just a day earlier. The ADX is used to measure the strength of a trend, regardless of its upward or downward direction. Values below 20 usually signal a market that is not trending, while values above 25 indicate a strong trend is underway.
This drop in ADX indicates that the previous consolidation trend is starting to lose strength. This opens up opportunities for a change in trend direction, especially if selling pressure continues to build. If the ADX continues to fall along with the emergence of bearish momentum, then this could be a confirmation that Mantra is moving from a consolidation phase to a downtrend.
Also Read: Will Bitcoin (BTC) Break $90,000? Check out the Analysis!
Bearish Signal from Ichimoku Cloud Indicator

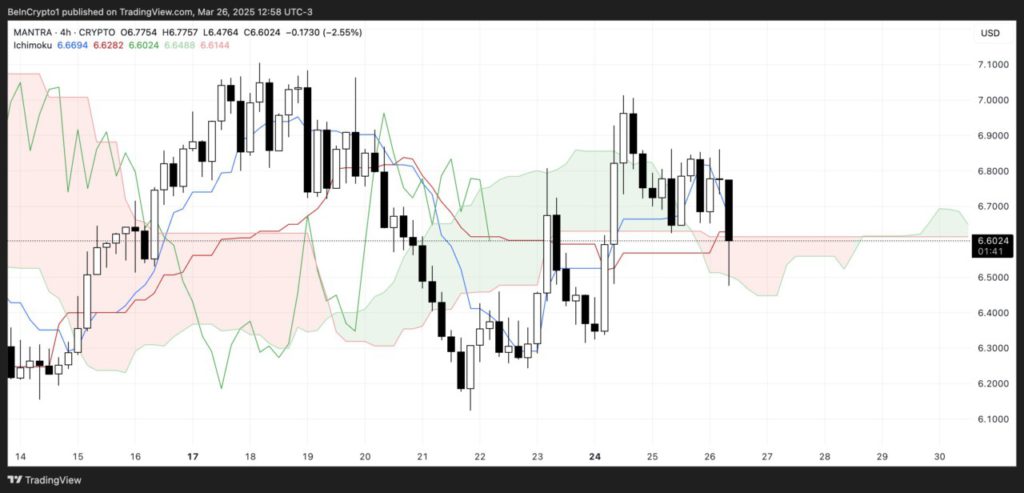
Through Ichimoku Cloud chart analysis, OM’s price movement appears to be on the edge of the cloud-signaling uncertainty between buying and selling strength. This position reflects market conditions that are still in a consolidation phase, with weak momentum. This is reinforced by the position of the Tenkan-sen and Kijun-sen lines which are flat and close to each other, typical of a stagnant market.
In addition, the future cloud started to thin out and turned red in color, signaling that forward price support is weakening. The Chikou Span or lagging line is also moving within the current price area, signaling a lack of clear direction. If OM prices break below the Ichimoku cloud, then a bearish trend could be confirmed.
Death Cross Threat and Spell Price Predictions

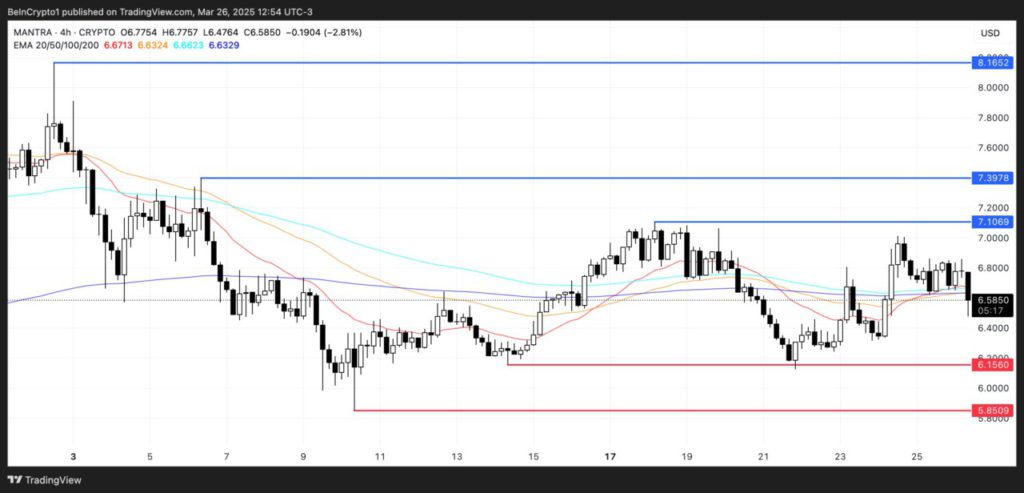
One of the main concerns right now is the potential formation of a death cross-abearish technical patternthat occurs when the short-term moving average crosses below the long-term average. If this pattern forms and selling pressure increases, then OM prices could test the support level at $6.15 (approx. IDR102,039).
If this support fails to hold, then a further drop towards $5.85 (IDR97,030) could occur. This would mark a deeper correction phase for OM, unless there is a major change in market sentiment. Conversely, if interest in RWA’s projects picks up again, Mantra’s price could bounce towards resistance at $7.10 (IDR117,927), and further to $7.39 (IDR122,723).
If the uptrend mimics the strength seen in the previous months, it is possible that OM could test the $8.16 (IDR135,573) price again as it did in late February.
Conclusion
Mantra (OM) is currently at a tipping point, where trend strength is weakening and downward pressure is starting to dominate key technical indicators. While it fundamentally remains one of the largest RWA tokens, the short-term price direction is highly dependent on market movements in the next few days. Investors and traders are advised to keep a close eye on technical developments and trading volumes for further direction.
Also Read: Ethereum (ETH) Prepares for the Next Big Move, Will it Rise April 2025?
That’s the latest information about crypto news today. Get more information about crypto academy from beginner to expert level only at Pintu Academy and enrich your knowledge about the world of crypto and blockchain.
Follow us on Google News to get the latest information about crypto and blockchain technology. Enjoy an easy and secure crypto trading experience by downloading Pintu Crypto via Google Play Store or App Store now.
Experience web trading with advanced trading tools such as pro charting, various order types, and portfolio tracker only at Pintu Pro. Click Register Pintu if you don’t have an account or click Login Pintu if you are already registered.
*Disclaimer
This content aims to enrich readers’ information. Pintu collects this information from various relevant sources and is not influenced by outside parties. Note that an asset’s past performance does not determine its projected future performance. Trading crypto carries high risk and volatility, always do your own research and use cold hard cash before investing. All activities of buying andselling Bitcoin and other crypto asset investments are the responsibility of the reader.
Reference:
- BeInCrypto. Mantra Faces Downside Pressure as Death Cross Looms. Accessed March 28, 2025.
- Featured Image: Medium


