Ethereum price rebounds, can bulls break this barrier?

Jakarta, Pintu News – Ethereum price recently experienced a downward correction and reached the $1,750 zone. Now, ETH is rising and trying to break the resistance at $1,850.
Ethereum Price Rise
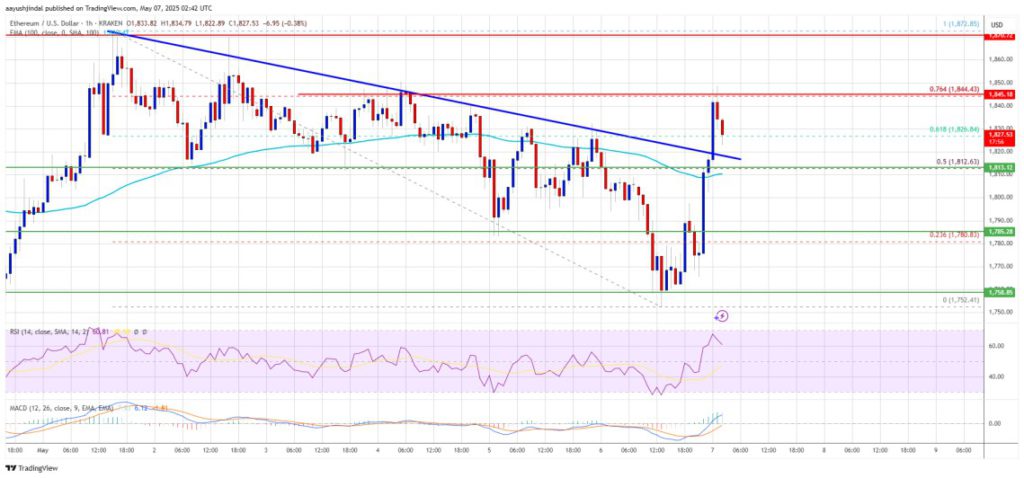
After declining from the $1,880 zone, similar to Bitcoin , Ethereum (ETH) price dropped below the $1,850 and $1,800 support levels. Finally, the price found support near the $1,750 level. A low was formed at $1,752 and the price started to increase again.
There was a rise above the $1,800 and $1,810 resistance levels. The price also managed to cross the 50% Fib retracement level of the decline from $1,872 to $1,752. In addition, there was also a break of the key bearish trend line with resistance at $1,820 on the hourly chart of ETH/USD. Currently, Ethereum (ETH) price is trading above $1,800 and the 100-hour simple moving average.
Also Read: Will Solana Reach $420 in 2025? Check out the Prediction!
Potential Barriers and Resistance
On the upside, the price seems to face resistance near the $1,840 level and the 76.4% Fib retracement level of the move down from $1,872 to $1,752. The next key resistance is near the $1,850 level, with the first major resistance near the $1,880 level.
If the price manages to cross the $1,880 resistance, it could push the price towards the $1,920 resistance. A break above the $1,920 resistance might trigger more gains in the coming sessions. In that scenario, Ethereum (ETH) could rise towards the $2,000 or even $2,050 resistance zone in the short term.
Possible Price Drop
If Ethereum (ETH) fails to break the $1,850 resistance, it could trigger a fresh decline. Initial support on the downside is near the $1,820 level, with the first major support in the $1,810 zone.
A drop below $1,810 support could push the price towards $1,780 support. Further losses might send the price towards $1,750 support in the short term. The next key support is at $1,665.
Technical Indicators
The hourly MACD for ETH/USD is gaining momentum in the bullish zone. The hourly RSI (Relative Strength Index) for ETH/USD is now above the 50 zone, showing strength in the current price uptrend.
The key support level is at $1,810, while the key resistance level is $1,850. These indicators provide a clearer picture of the potential price movement of Ethereum (ETH) going forward.
Conclusion
With Ethereum (ETH) price recovering and the potential to break higher resistance, the market may witness increased trading activity. Investors and traders should monitor technical indicators and support and resistance levels to make informed trading decisions.
Also Read: Bitcoin Poised for a Big Spike Amid US Economic Chaos?
That’s the latest information about crypto. Follow us on Google News for the latest crypto and blockchain technology updates. Enjoy an easy and secure crypto trading experience by downloading Pintu crypto app via Google Play Store or App Store now.
Experience web trading with advanced trading tools such as pro charting, various order types, and portfolio tracker only at Pintu Pro. Pintu Pro Futures is also available, where you can buy bitcoin leverage, trade btc futures, eth futures and sol futures easily from your desktop!
*Disclaimer
This content aims to enrich readers’ information. Pintu collects this information from various relevant sources and is not influenced by outside parties. Note that an asset’s past performance does not determine its projected future performance. Crypto trading activities are subject to high risk and volatility, always do your own research and use cold hard cash before investing. All activities of buying andselling Bitcoin and other crypto asset investments are the responsibility of the reader.
Reference
- NewsBTC. Ethereum Price Regains Traction, $1,750 Next?. Accessed on May 7, 2025
- Featured Image: Bitcoinist