Top 3 Crypto AI: NEAR, FET, and ICP Predicted to Double in June 2025!
Jakarta, Pintu News – Artificial Intelligence tokens in the crypto market have seen a considerable rise, with the sector’s market capitalization jumping 17% during May and now standing at $38 billion.
Although tokens from the Decentralized Finance sector and meme coins are currently leading the market rally, there is a possibility of segment rotation that could potentially push AI tokens to lead the market rally within the next week, according to price predictions circulating.
AI Tokens Start to Gain Ground
As reported by FX Street (29/5), the market capitalization for AI-based crypto has increased from $32.46 billion to $38.08 billion in the past 30 days, recording an inflow of funds of nearly $6 billion.
Read also: These 3 Crypto AIs Have the Potential to Rise Like Crazy in June 2025
With these increased fund flows, AI tokens are expected to be the leaders in the next market rally, especially since the crypto market is currently undergoing massive capital rotation into various sectors.
In the past month, tokens from the privacy sector, DeFi, and meme coins experienced gradual and sequential price spikes.
With the modest gains made this week, AI tokens are signaling a possible trend reversal that could make them the next sector to dominate the market rally.
In addition, updates from top AI companies such as OpenAI, Google Gemini, and DeepSeek also have the potential to strengthen price predictions and trigger double-digit price spikes.
NEAR Aims for Breakout of Inverse Head and Shoulders Pattern
Near Protocol has gained nearly 20% throughout May and is now approaching the psychological $3 level. At the time of writing on Thursday, the AI token is trading at $2.94, forming the “right shoulder” part of an Inverse Head and Shoulders pattern on the daily price chart.
With the appearance of three consecutive bullish candlesticks, this uptrend is approaching the supply zone at the $3 level which acts as theneckline of the pattern.
The MACD (Moving Average Convergence/Divergence) indicator is also approaching its signal line, signaling a possible bullish crossover, indicating a potential trend reversal.
Data from DeFiLlama showed significant growth in Total Value Locked (TVL) in Near Protocol, which rose to $173 million from this year’s low of $124 million on April 9.
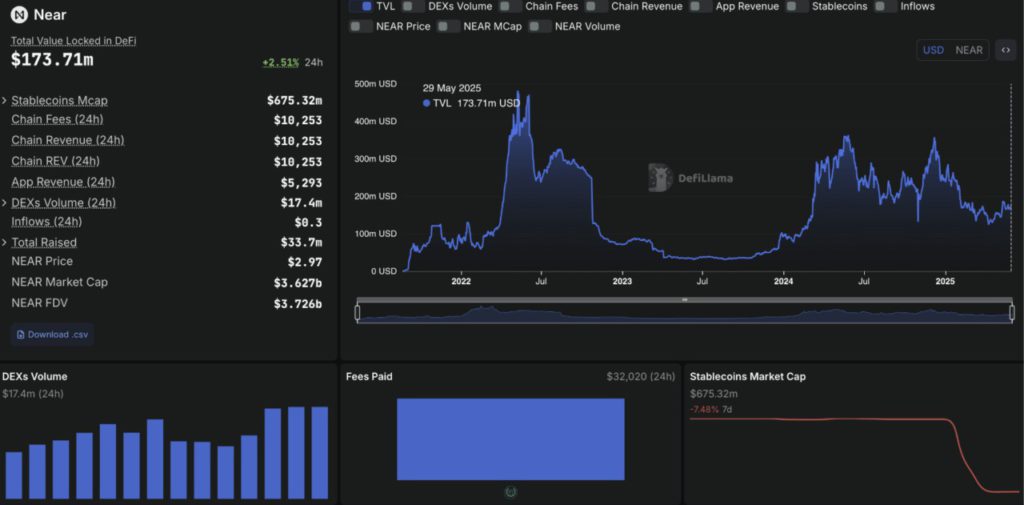
In addition, the transaction volume on Near’s DEX (Decentralized Exchanges) remained above $17 million for the third consecutive day. However, a 7% drop in the stablecoin’s market capitalization to $675 million provided a warning signal of a potential liquidity crisis on the network.
Overall, Near Protocol showed improved performance in the DeFi sector, in line with predicted price increases.
If the price manages to break the neckline at $3 cleanly, then the next supply zone at $3.50 is likely to be tested – a level that previously led to several failed breakouts in February.
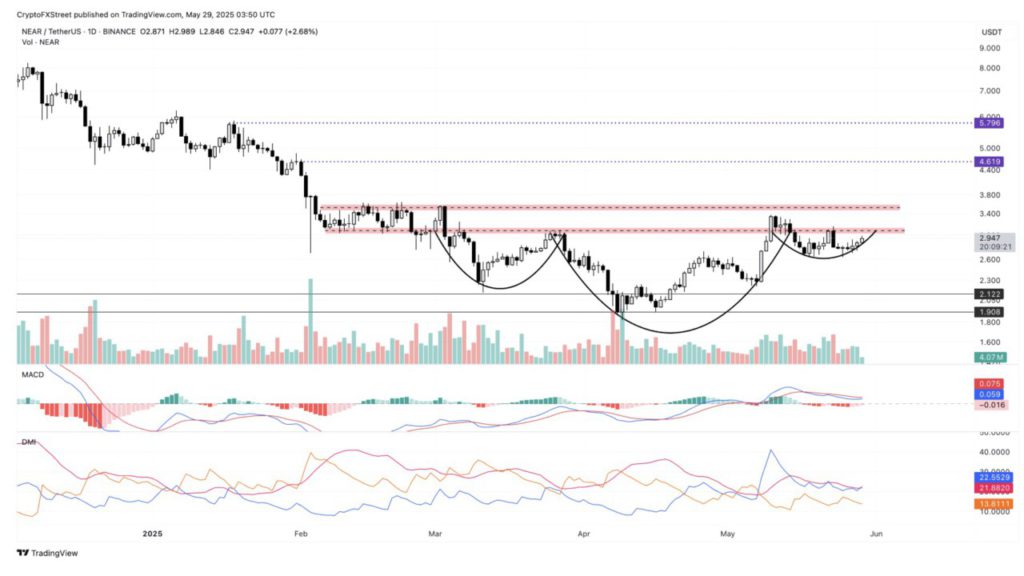
If the price is able to break and hold above $3.50, the potential for further gains could reach nearly 20%.
Read also: Hyperliquid trader turns $3 million into $27.5 million in a flash as crypto market explodes!
But on the other hand, if NEAR fails to break the supply zone, the price could correct down to the $2.64 support level formed on May 18.
FET Aims to Return to $1 Level
The token of the Artificial SuperIntelligence Alliance traded at $0.91 on Thursday, recording a gain of 21% so far in May – continuing the 62% rally that occurred in April.
As FET approaches the $1 psychological level, the current uptrend is forming a support trend line with a pattern of higher lows since last month.
FET price is now above the 200-day Exponential Moving Average (EMA) at $0.89, increasing the chances of a bullish crossover between the 50-day EMA and the 100-day EMA. The MACD indicator has also crossed its signal line, triggering a buy signal that reinforces the uptrend potential.
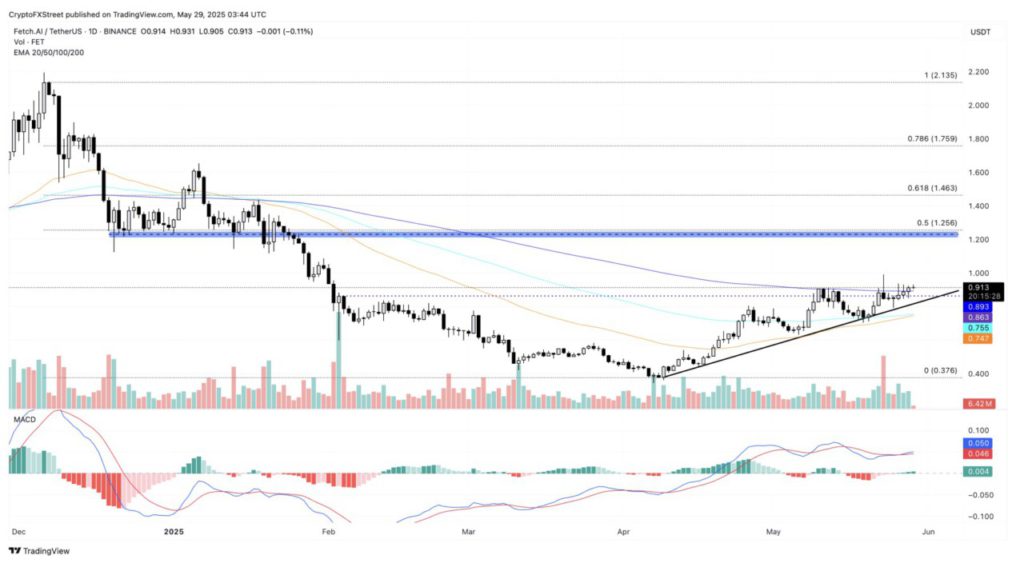
However, the subsequent price zone between $1.04 to $1.22 was met with heavy selling pressure, with a supply of 710.6 million FET tokens.
If traced using the Fibonacci retracement tool of the 82% price drop from $2.13 (December 6) to $0.37 (April 8), the 50% retracement level is at $1.25 – which also coincides with the upper limit of the $1.20 supply zone.
If the bullish trend continues, investors are expected to push the price up towards the 50% Fibonacci level at $1.25, which provides up to 25% upside potential if FET manages to break $1.
According to IntoTheBlock’s Global In/Out of the Money (GIOM) indicator, the nearest resistance zone was between $0.93 and $1.02, where about 2,020 investors bought 35.02 million FET tokens at an average price of $0.97.
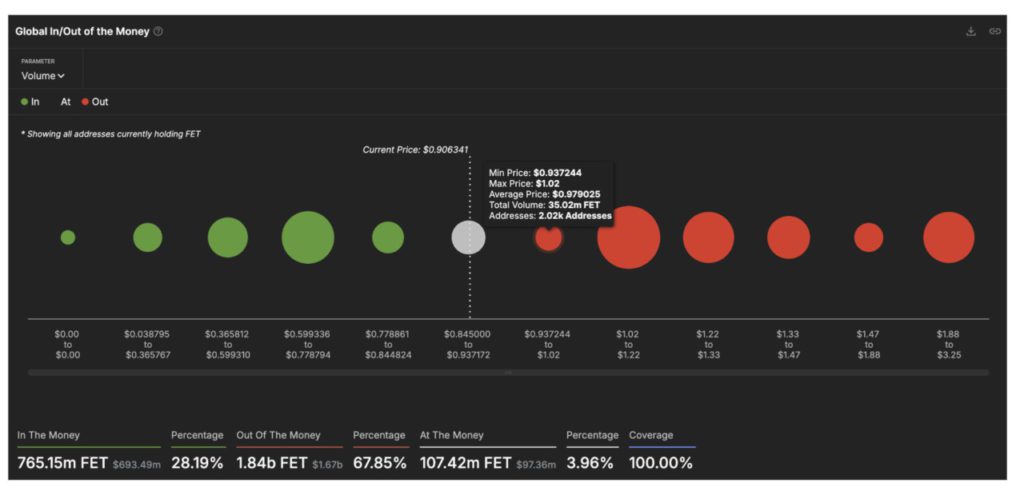
Compared to the current “At the Money” zone, which is between $0.84 and $0.93 – where 5,720 investors hold 107.42 million FET tokens – this nearby resistance zone has a lower supply. This increases the likelihood of an uptrend continuation above the $1 level.
Read also: Altcoins Ready to Explode? This chart shows the Altcoin Season is about to begin!
However, if FET fails to break the $1 level convincingly, the price risks dropping back to the support trend line around $0.82.
ICP Poised to Continue its Rise Toward $6
Internet Computer is approaching its fifth consecutive bearish monthly close, despite having recorded a 10% gain throughout May.
As ICP begins to show signs of trend reversal, daily price action and technical indicators hint at a potential bullish bias.
The AI-based crypto token is trading at $5.51 with a daily gain of over 1%, nearing a 7-day high of $5.84.
Momentum indicators support a potential breakout: MACD and its signal line are approaching each other, opening up the opportunity for a bullish crossover. Meanwhile, the RSI line is at the 55 level and continues to climb, indicating an increase in the strength of the uptrend.
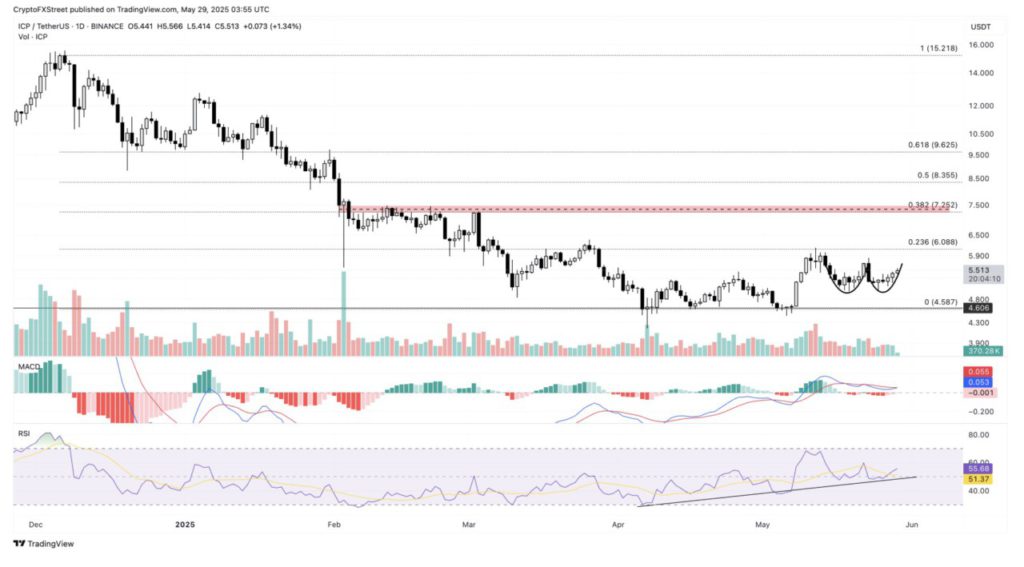
The nearest resistance is at $6.08, which aligns with the 23.6% Fibonacci level of the 70% price correction – i.e. from $15.22 to $4.58 that occurred between December 7 and April 8.
However, if the price fails to break the $5.84 resistance and reverses, this bullish pattern could be invalidated and the price risks dropping to the weekly support level at $5.01.
That’s the latest information about crypto. Follow us on Google News to stay up-to-date on the world of crypto and blockchain technology.
Enjoy an easy and secure crypto trading experience by downloading Pintu crypto app via Google Play Store or App Store now. Also, experience web trading with advanced trading tools such as pro charting, various types of order types, and portfolio tracker only at Pintu Pro. Pintu Pro Futures is also available, where you can buy bitcoin leverage, trade btc futures, eth futures and sol futures easily from your desktop!
*Disclaimer
This content aims to enrich readers’ information. Pintu collects this information from various relevant sources and is not influenced by outside parties. Note that an asset’s past performance does not determine its projected future performance. Crypto trading activities have high risk and volatility, always do your own research and use cold cash before investing. All activities of buying and selling bitcoin and other crypto asset investments are the responsibility of the reader.
Reference:
- FX Street. Top AI crypto to watch: NEAR, FET, and ICP price predictions support double-digit gains. Accessed on May 30, 2025