Ethereum Holds Strong at $2,400 as ETF Inflows Soar to $260 Million — Is a Massive Rally Coming?

Jakarta, Pintu News – Ethereum is back at a crucial level after dipping below $2,500, just as institutional fund flows into Ethereum ETFs have risen for seven consecutive weeks.
Despite consistent trust from major players, the price of ETH has yet to show a significant increase. Some analysts still see upside potential in the second half of 2025, but time is running out.
Then, can Ethereum strengthen again? Let’s take a look at the on-chain data and key technical indicators that influence ETH’s next move.
Ethereum Price Drops 2.24% in 24 Hours
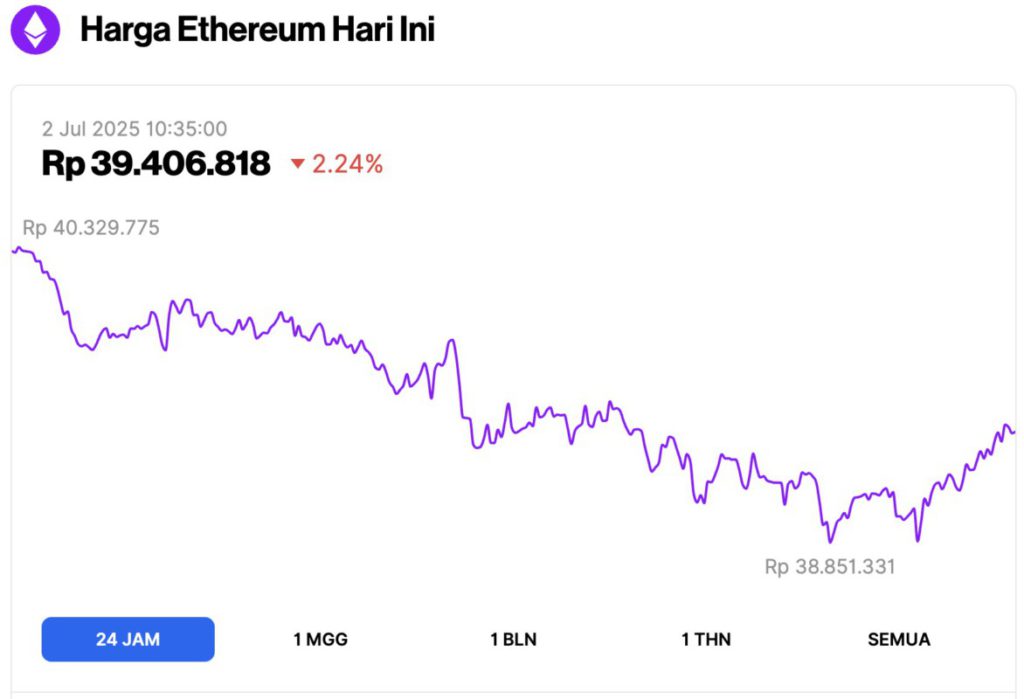
As of July 2, 2025, Ethereum was trading at approximately $2,427, or around IDR 39,406,818, after experiencing a 2.24% dip over the past 24 hours. During that time, ETH reached a high of IDR 40,329,775 and dropped to a low of IDR 38,851,331.
At the time of writing, data from CoinMarketCap shows that Ethereum’s market capitalization stands at around $293.11 billion, with daily trading volume falling 3% to $16.38 billion within the last 24 hours.
Read also: Bitcoin Crashes to $106K After Senate’s Shocking Vote — Is the “Big Beautiful Bill” Behind the Drop?
Surge in Inflows to Ethereum ETFs
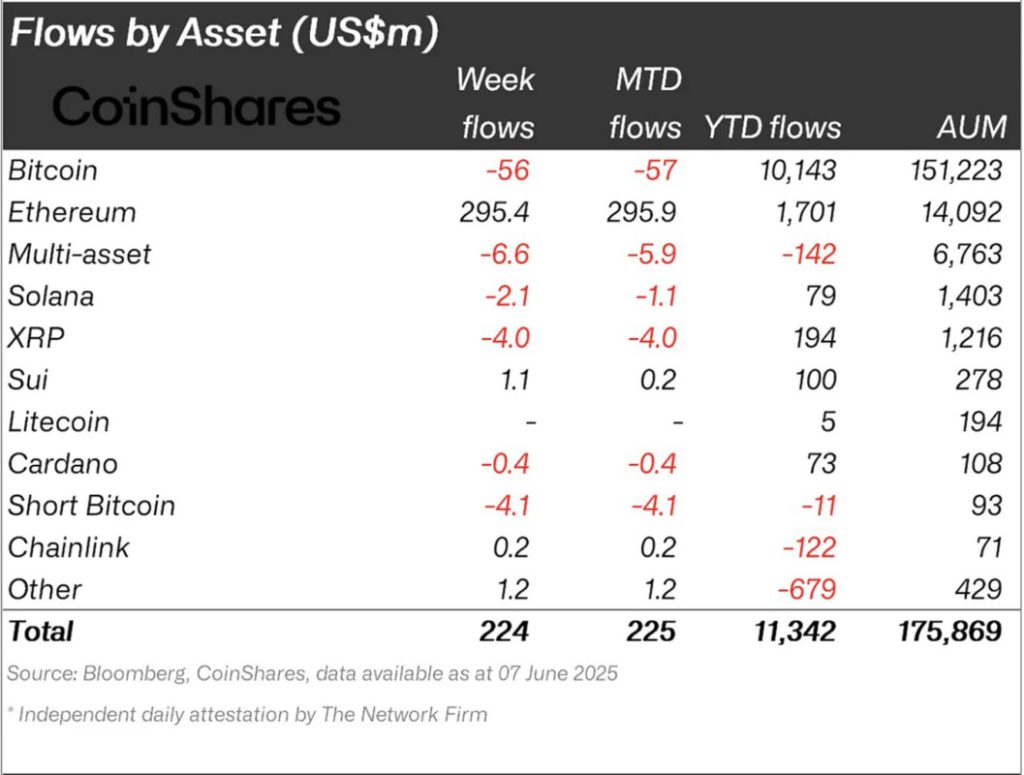
As reported by CoinShares, the Ethereum ETF has finally started to show significant progress. After a sluggish first quarter, fund inflows began to increase sharply in the second half of the second quarter (Q2).
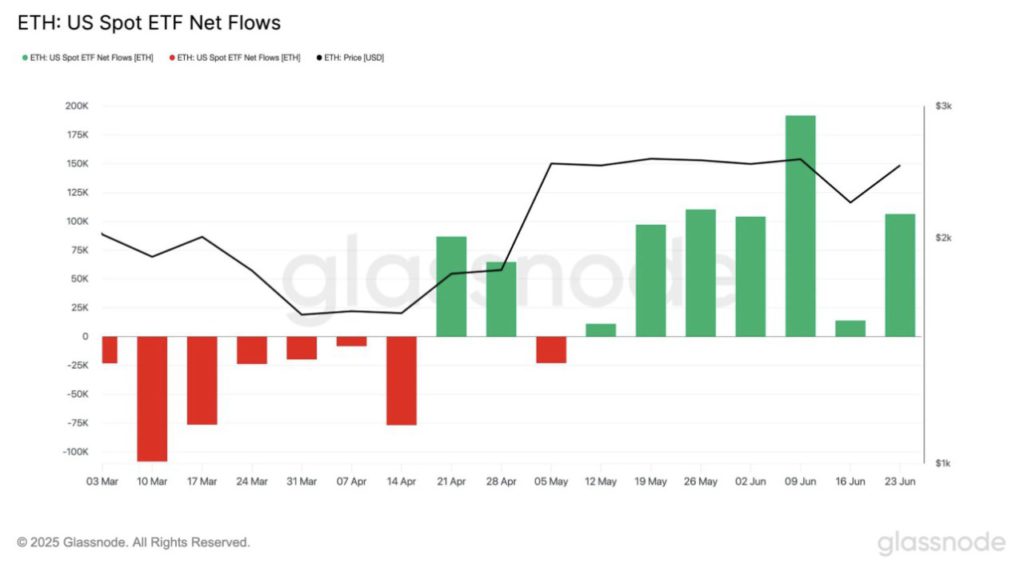
Furthermore, according to data from Glassnode, Ethereum ETF products managed to attract 106,000 ETH last week, marking seven consecutive weeks of positive inflows.
At current prices, this amount equates to over $260 million flowing into ETH through institutional channels. Historically, this kind of momentum usually drives prices up.
But so far, ETH hasn’t shown any major movement. Although it managed to stay above the $2,000 level, ETH has only risen by about 2.4% over the past week. As of July 1, 2025, ETH’s movement has been flat.
Even so, other on-chain signals suggest that ETH could be preparing for a bigger move and possibly avoiding the next big drop.
Why Price Hasn’t Followed the Inflows
Ethereum still needs additional driving force to break out of the current consolidation zone.
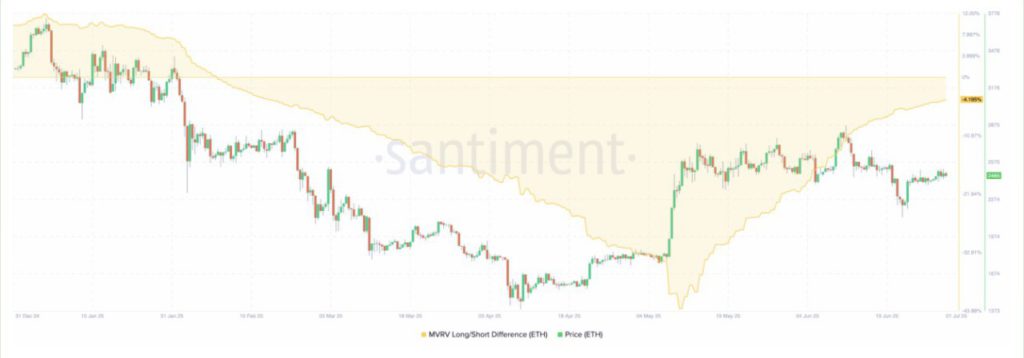
For example, data from Santiment shows that the Market Value to Realized Value (MVRV) Long/Short spread has increased from -43.34% in May to -4.20% today.
This increase in the Long/Short MVRV difference indicates that long-term holders are now starting to have higher potentialunrealized profits than short-term holders.
Read also: After 10 Years of Silence, Ethereum Whale Awakens to Unbelievable 787,000% Profit!
Historically, this is a bullish signal; however, this metric must surpass the zero line to truly confirm ETH’s potential price recovery. If this happens, then ETH could rise towards the $3,000 level this month.
Supporting this indicator, Shawn Young, Chief Analyst at MEXC Research, mentioned that inflows into Ethereum ETFs last month could be one of the reasons for the crypto’s price increase in July.
While mentioning other factors, the analyst said that the ETH price could reach its highest level in months.
“With risk appetite slowly returning to the market, the geopolitical situation stabilizing, and global liquidity improving, ETH is in a strong enough position to register further gains in the coming weeks. If the current momentum continues and macro conditions remain favorable, a move towards $3,000-maybe even $3,300-is increasingly plausible,” Young told CCN.
ETH Price Prediction: Levels to Watch
From a technical point of view (1/7/25), CCN notes that Ethereum price has formed a bull flag pattern. This pattern started with a sharp uptrend to $2,679 around the second week of May, and then formed a flag pattern when the price started to move sideways(consolidation).
During this consolidation phase, the Awesome Oscillator (AO) indicator is still in the negative zone. However, the green histogram bars show that momentum is starting to shift from bearish to bullish. If this trend continues and the AO manages to break the zero signal line, ETH prices could potentially break the resistance level at $2,745.
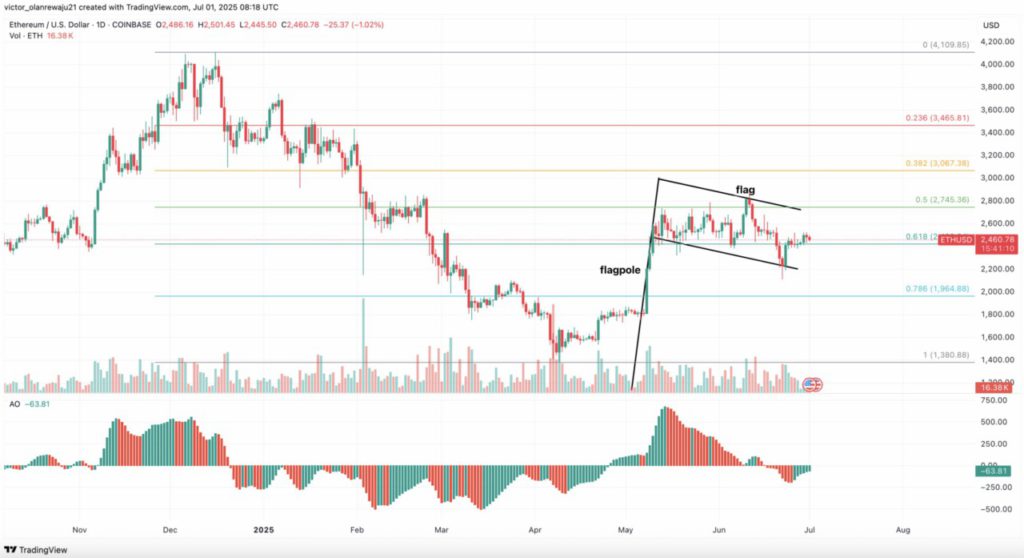
If this level is successfully broken, the value of the crypto could be pushed up to $3,067. Stronger buying pressure could even push ETH all the way to $3,465.
Conversely, if the bulls fail to push the price past the upper trendline of the bull flag pattern, then this prediction is unlikely to be achieved. In that scenario, Ethereum price could drop back below $2,000.
That’s the latest information about crypto. Follow us on Google News to stay up-to-date on the world of crypto and blockchain technology.
Enjoy an easy and secure crypto trading experience by downloading Pintu crypto app via Google Play Store or App Store now. Get a web trading experience with advanced trading tools such as pro charting, various types of order types, and portfolio tracker only at Pintu Pro. Pintu Pro Futures is also available, where you can buy bitcoin leverage, trade btc futures, eth futures and sol futures easily from your desktop!
*Disclaimer
This content aims to enrich readers’ information. Pintu collects this information from various relevant sources and is not influenced by outside parties. Note that an asset’s past performance does not determine its projected future performance. Crypto trading activities have high risk and volatility, always do your own research and use cold cash before investing. All activities of buying and selling bitcoin and other crypto asset investments are the responsibility of the reader.
Reference:
- CCN. ETH Price at Critical Juncture as Ethereum ETF Inflows Hit $260M. Accessed on July 2, 2025