Crypto Market Overview (7/21/25): Capitalization Skyrockets & Fear and Greed Index Enters Green Zone
Jakarta, Pintu News – The cryptocurrency market showed positive performance on July 21, 2025, with the total global market capitalization jumping to $3.95 trillion. Investor sentiment has also strengthened, reflected by the Fear and Greed Index which is now at 67, signaling that the market is in the “Greed” zone.
This rise was driven by the strengthening of major assets such as Bitcoin , Ethereum , and Solana , each of which recorded significant daily growth. Is this a sign that the altcoin season is about to begin?
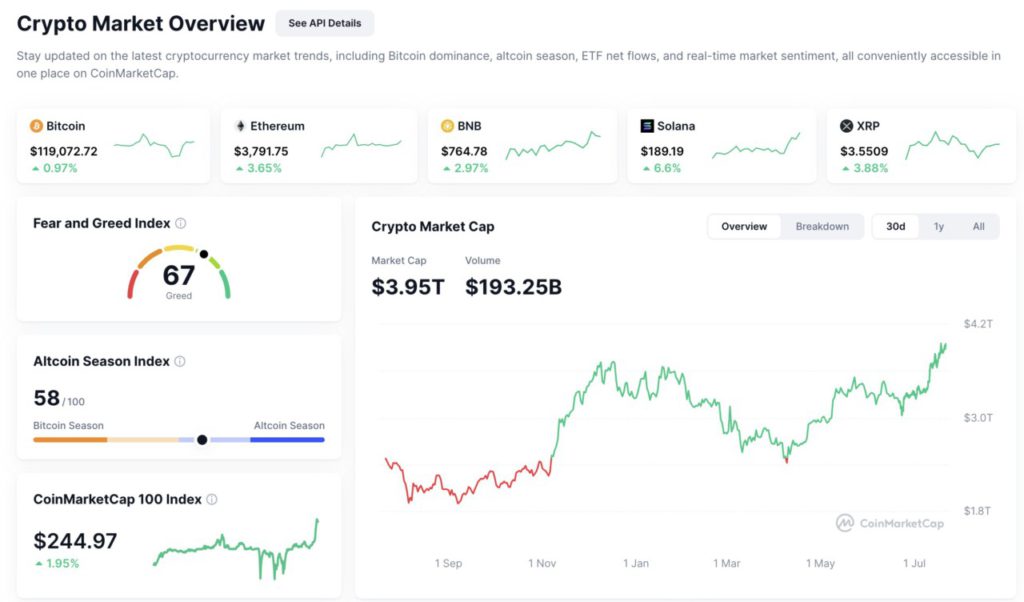
The image above presents a summary of the latest crypto market conditions as of July 21, 2025, which includes global market capitalization, daily trading volume, Fear and Greed index, performance of major assets such as Bitcoin (BTC), Ethereum (ETH), and altcoins such as Solana (SOL) and XRP. Below is a detailed explanation of each element shown.
Crypto Market Strengthens: Capitalization Reaches $3.95 Trillion
The image above shows the total crypto market capitalization currently stands at $3.95 trillion, with a daily trading volume of $193.25 billion. The chart over the past 30 days shows a fairly sharp uptrend, especially since early July, signaling positive momentum across the crypto market.
This increase in capitalization is also supported by the strong performance of a number of large assets such as Bitcoin (BTC), Ethereum (ETH), and Solana (SOL). Technically, the market appears to be heading towards a new resistance point in the range of $4.2 trillion.
Fear and Greed Index: Market Dominated by Greed Sentiment
The Fear and Greed Index stands at 67, which means the market is currently in a state of “Greed”. This number reflects investors’ increasing optimism about the state of the crypto market, which usually happens when prices start to rise and transaction volumes increase.
This kind of sentiment often drives further price spikes, but it can also be a cautionary signal for investors who fear a potential sudden correction. The index’s position is approaching the extreme greed zone, suggesting that many investors are starting to FOMO (fear of missing out).
Altcoin Season Index and Big Coin Performance
The Altcoin Season Index stands at 58, indicating the dominance of altcoins is starting to increase even though it is not quite “Altcoin Season” yet. This is characterized by the strong performance of altcoins such as Solana (SOL) which rose 6.6% to a price of $189.19, as well as XRP which rose 3.88% to $3.55.
Ethereum (ETH) also recorded a 3.65% gain to $3,791, supporting the altcoin’s dominance in recent days. On the other hand, Bitcoin (BTC) remained steady with a gain of 0.97%, signaling that the asset is still the main anchor of the market, although attention is starting to shift to altcoins.
Read also: Ethereum (ETH) Surges Above $3,600: Is $6,000 the Next Target?
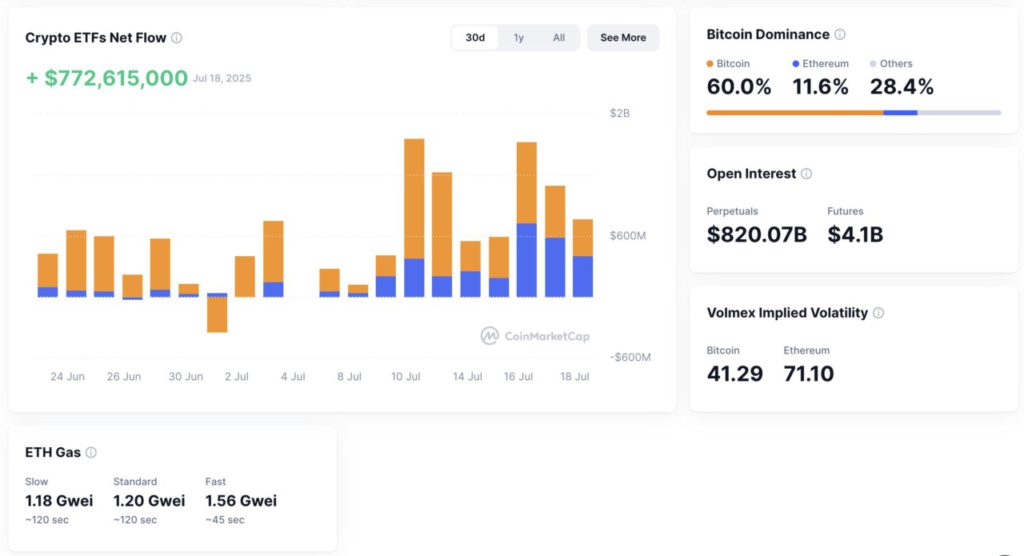
The image above presents recent crypto market data that includes ETF net flows, Bitcoin dominance, derivatives data, volatility, as well as Ethereum (ETH) gas fees. A detailed explanation of each element follows:
Positive Fund Flows to Crypto ETFs: +$772.6 Million
The top left part of the chart displays Crypto ETFs Net Flow, which is the net amount of funds that have entered or exited crypto ETF products over the past 30 days. On July 18, 2025, a positive inflow of +$772,615,000 was recorded, which is a strong signal that institutional interest in crypto is on the rise.
The orange and blue colors on the chart represent different types of ETF products, with a predominantly positive trend since mid-July. This reinforces the narrative that investors see growth opportunities in the crypto market in the short to medium term.
Bitcoin’s dominance is still strong, but altcoins are strengthening
On the top right, Bitcoin Dominance is displayed, which is the portion of Bitcoin’s market capitalization compared to the total crypto market. Currently, Bitcoin’s dominance stands at 60.0%, while Ethereum (ETH) is only 11.6%, and other altcoins (Others) are 28.4%.
While BTC still dominates, altcoins are showing noteworthy growth trends, especially as altcoin season momentum starts to emerge in the market. This large dominance also means that Bitcoin’s price movements are still the main driver of the overall crypto market dynamics.
Derivatives & Volatility: Massive Activity in Perpetual Contracts
Open Interest data shows the total value of active derivative contracts in the crypto market. The value reached $820.07 billion for perpetual contracts and $4.1 billion for futures, signaling traders’ interest in leveraged positions is very high.
On the other hand, the Volmex Implied Volatility Index records Bitcoin’s volatility at 41.29 and Ethereum’s much higher at 71.10, indicating that ETH is currently more volatile than BTC. This is important for short-term traders as high volatility means greater profit (and risk) opportunities.
Super Low Ethereum Gas Fees: Under 2 Gwei
At the bottom, it appears that the ETH Gas Fee is very low. Ethereum transaction fees currently range from 1.18-1.56 Gwei, for both slow, standard and fast transactions. This means that users can transfer or interact with smart contracts on the Ethereum network with very low fees and relatively fast processing times (around 45-120 seconds). Such low gas conditions are ideal for high activity in DeFi, NFT minting, or token swaps.
That’s the latest information about crypto. Follow us on Google News to get the latest information about the world of crypto and blockchain technology. Check today‘ s bitcoin price, today’s solana price, pepe coin and other crypto asset prices through Pintu Market.
Enjoy an easy and secure crypto trading experience by downloading Pintu crypto app via Google Play Store or App Store now. Also, get a web trading experience with various advanced trading tools such as pro charting, various types of order types, and portfolio tracker only at Pintu Pro.
*Disclaimer
This content aims to enrich readers’ information. Pintu collects this information from various relevant sources and is not influenced by outside parties. Note that an asset’s past performance does not determine its projected future performance. Crypto trading activities have high risk and volatility, always do your own research and use cold cash before investing. All activities of buying and selling bitcoin and other crypto asset investments are the responsibility of the reader.
Reference
- Coinmarketcap
- Featured Image: Generated by AI


