Discover the Secrets of Market Profits with the Momentum Indicator, Beginner Investors Must Know!

Jakarta, Pintu News – The use of momentum indicators in technical analysis has become an important tool for traders to gauge the strength of stock price trends. They provide insight into how quickly the price of an asset is changing, which can help in making decisions on when to enter or exit the market. This article will take a closer look at the Relative Strength Index (RSI), one of the most commonly used momentum indicators.
Definition of Momentum Indicator
A momentum indicator is a tool in technical analysis used to assess the strength or weakness of a stock’s price trend. It measures the rate of change in a stock’s price. By understanding momentum, investors can identify potential gains by following the ongoing price trend, be it an uptrend or a downtrend.
Using momentum indicators allows market participants to profit by following the trend. In addition, they are also useful for protecting profits by exiting the market when the trend starts to reverse. History has shown that information about momentum is very useful, especially in rising markets, as markets tend to stay up longer than they go down.
Also Read: 5 Shocking Predictions: Pi Network (PI) Price in August 2025, Potential to Soar or Plummet?
Relative Strength Index (RSI)
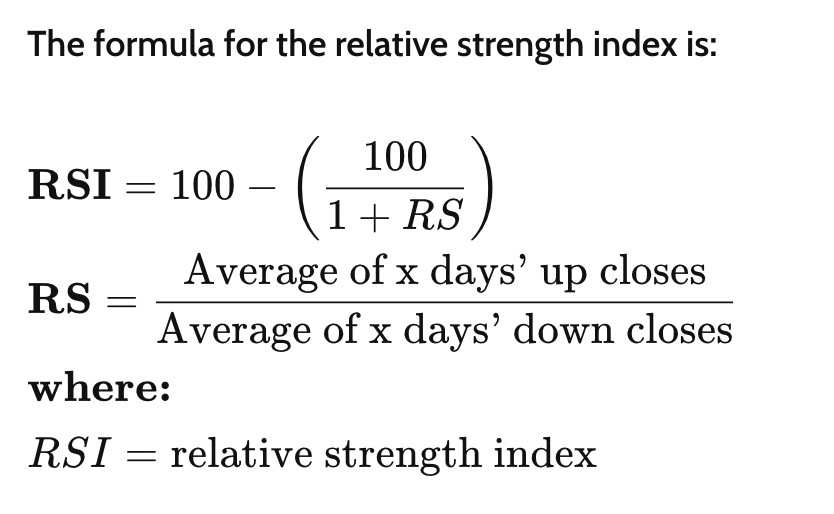
The RSI, created by J. Welles Wilder Jr. in the late 1970s, measures the speed and magnitude of price changes. On a chart, the RSI assigns a momentum value between 0 and 100 to a stock. This value can then be compared to standard thresholds, usually set at 70 and 30 levels, which signal overbought and oversold assets.
Traders can adjust the RSI parameters to 80 and 20, or even 90 and 10, to give more room for overbought and oversold conditions. This can help avoid false trading signals and premature trading decisions. The RSI is usually plotted on a daily time frame, but sometimes also on an hourly period to gain insight into short-term asset purchases.
Difference between RSI and Relative Strength
There is often confusion between RSI and relative strength (RS). RS compares a stock’s price to other stocks or the market as a whole, while RSI measures the speed at which a stock’s price changes. The RSI can indicate whether the price action of an asset reflects excessive buying or selling.
The RSI works best when used in conjunction with other momentum indicators, such as the crossover of short-term moving averages. For example, a crossover between the 10-day and 25-day moving averages can indicate a change in trend direction. This often happens in conjunction with the RSI being in the 20/30 or 70/80 range, giving a clear reading of overbought or oversold conditions.
Conclusion
Momentum indicators, such as the RSI, provide important insights into the strength or weakness of a price trend as they focus on the rate of price change. Using the standard levels of 70 (overbought) and 30 (oversold), or more extreme levels if desired, traders can determine potential entry and exit points for their trades. Despite the drawback of delayed information, the use of this indicator remains an important part of many investors’ trading strategies.
Also Read: 7 Facts How Ethereum Changed the World of Crypto & Cryptocurrency Over 10 Years!
Follow us on Google News to get the latest information about the world of crypto and blockchain technology. Check today‘ s bitcoin price, today’s solana price, pepe coin and other crypto asset prices through Pintu Market.
Enjoy an easy and secure crypto trading experience by downloading Pintu crypto app via Google Play Store or App Store now. Also, get a web trading experience with various advanced trading tools such as pro charting, various types of order types, and portfolio tracker only at Pintu Pro.
*Disclaimer
This content aims to enrich readers’ information. Pintu collects this information from various relevant sources and is not influenced by outside parties. Note that an asset’s past performance does not determine its projected future performance. Crypto trading activities are subject to high risk and volatility, always do your own research and use cold hard cash before investing. All activities of buying andselling Bitcoin and other crypto asset investments are the responsibility of the reader.
Reference
- Investopedia. Momentum and Relative Strength Index. Accessed on August 1, 2025
Latest News

UBS Gold Price Today, April 29, 2026