Pi Network Coin Holds Strong at $0.35 — Is a Recovery on the Horizon?

Jakarta, Pintu News – While the rest of the crypto market is busy looking for coins that are able to break record high prices, the price of Pi Coin (PI) is moving in the opposite direction, continuing to set new record lows from time to time.
In the last 24 hours, the value of the PI coin fell by 0.4%, and by almost 25% over the last month. The latest record low? It just happened yesterday.
However, a number of technical signals now suggest that PI prices may be approaching a short-term reversal phase. A single divergence pattern on the chart, plus weakening selling pressure and improving sentiment, could be the turning point for this price movement.
Pi Network Price Drops 0.4% within 24 Hours
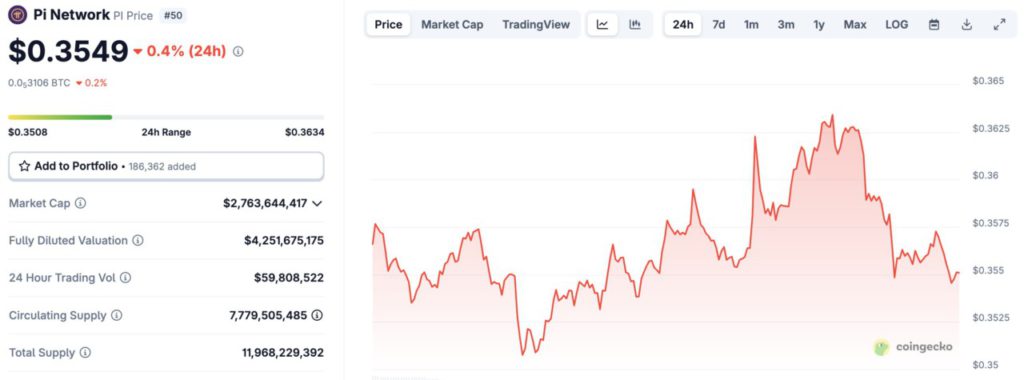
On August 5, 2025, the price of Pi Network was recorded at $0.3549, a decrease of 0.4% in the last 24 hours. If converted to the current rupiah ($1 = IDR 16,390), then 1 Pi Network is IDR 5,816.
Read also: Dogecoin Climbs Today (August 5) — Is Its RSI Sparking a Bullish Turn?
Throughout the day, the price moved within a range of $0.3508 to $0.3634, showing relatively moderate volatility.
In terms of market fundamentals, PI’s current market capitalization stands at around $2.76 million, while its fully diluted valuation (FDV) stands at $4.25 billion. Market activity is quite visible with 24-hour trading volume reaching $59.8 million.
Bears Start Losing Grip, Market Power Shifts to Bulls
Over the past few weeks, sellers (bears) have been in full control of the PI trend. This is where the Bull-Bear Power (BBP) indicator becomes important. In a long downtrend, diminishing selling pressure is usually a signal that the sellers are running out of steam.
That’s what’s starting to show on the chart right now. Since August 1, BBP has been steadily moving up, shifting from a deep negative zone towards more moderate levels-a pattern similar to the movement on July 15-21. Back then, weakening bearish momentum preceded the price increase from $0.45 to $0.52.
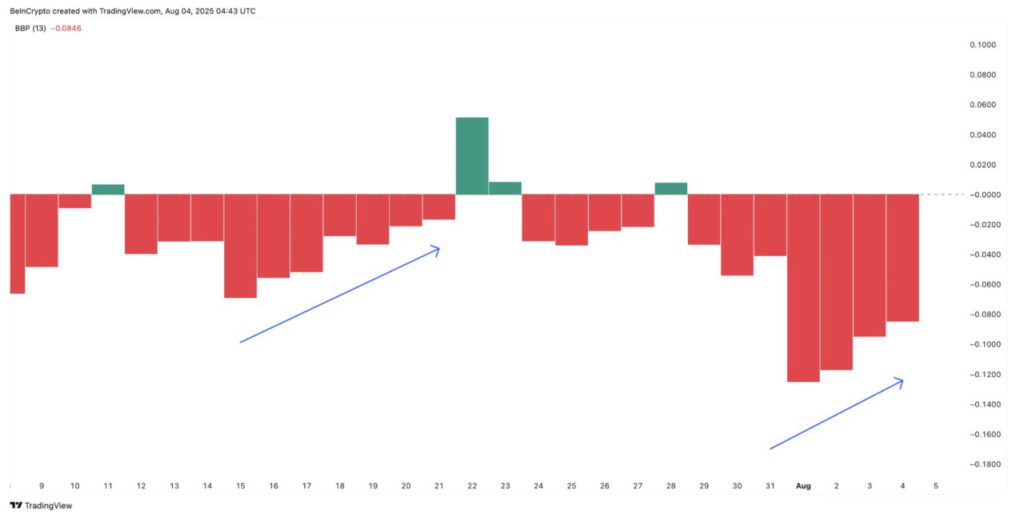
The BBP indicator itself measures the difference between the highest price and the short-term moving average to show which side is in control of the market, bulls or bears.
Additional support comes from the social dominance metric, which calculates how much of the crypto conversation is about PI.
Between August 1-3, PI’s social dominance recorded three consecutive days of progressively higher peaks, similar to the July 15-23 period. Back then, the same pattern coincided with a local low and triggered a spike to $0.52.
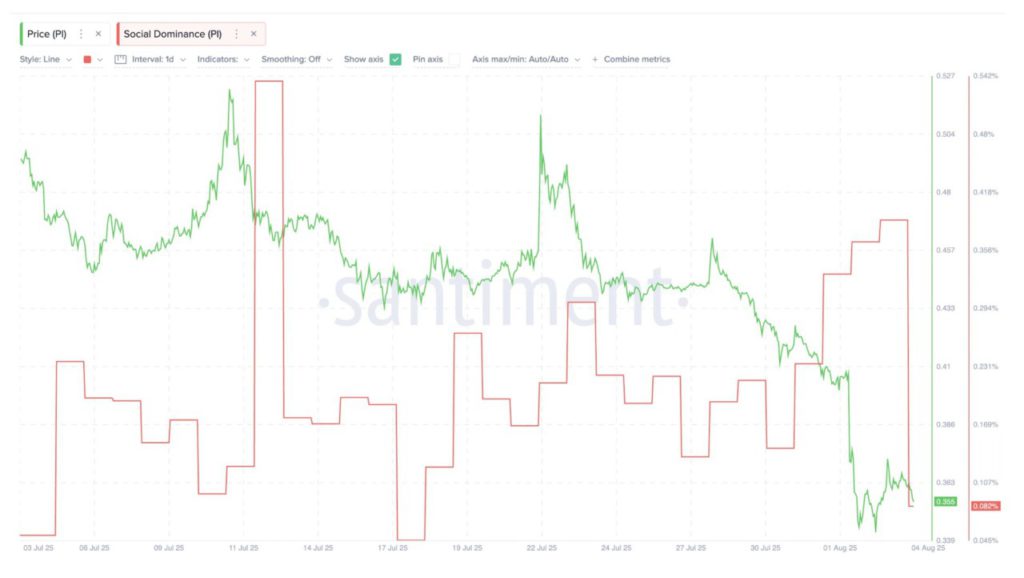
The combination of improving sentiment and weakening selling pressure now reinforces the possibility that PI prices are preparing for the next leg up.
RSI Shows Bullish Divergence, But Pi Coin Price Must Respond
Pi Coin’s Relative Strength Index (RSI) is currently at 23.37-an area that signals an oversold condition. However, it’s not just the numbers that matter, the patterns that form are more interesting to watch.
The PI price recently printed a higher low, while the RSI formed a lower low. This pattern is known as a hidden bullish divergence and often appears before the price hits a local low.
Read also: Pi Network Drops Mining Rate to Lowest Level, What’s the Impact?
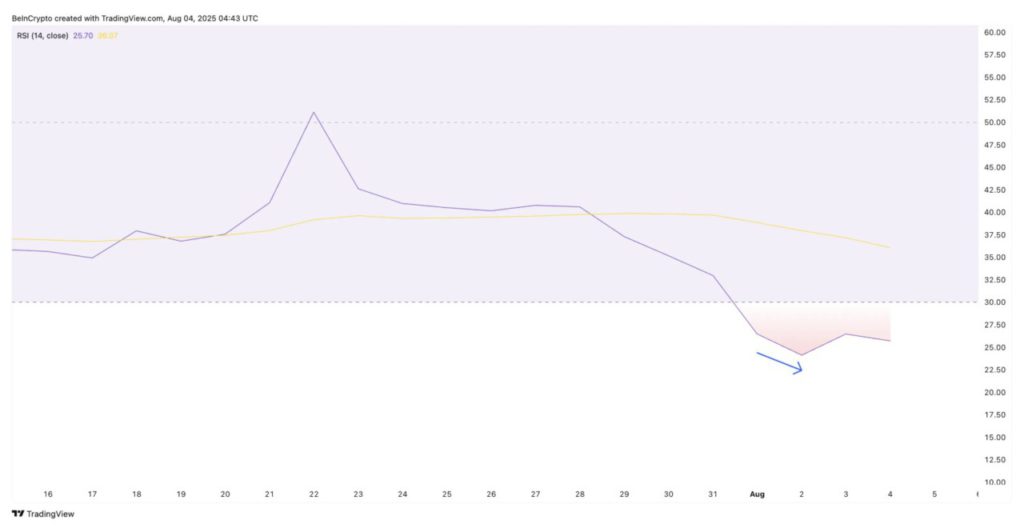
At first glance, a continuously falling RSI looks bearish. But when the price doesn’t fall with it, it’s usually a sign that the downward momentum is weakening, even though sellers are still trying to push.
This means that supply pressure is no longer able to push prices down further-a potential signal of a bottom forming.
Even so, this kind of RSI divergence alone is not enough to confirm a rebound, especially in the midst of PI’s still-declining price trend. It’s more like a subtle early signal.
For this signal to be truly confirmed, the price must be able to break out of the resistance area.
As a reminder, RSI is a momentum oscillator that measures the speed and change in price movement. Readings below 30 usually indicate the asset is oversold and could potentially experience a reversal.
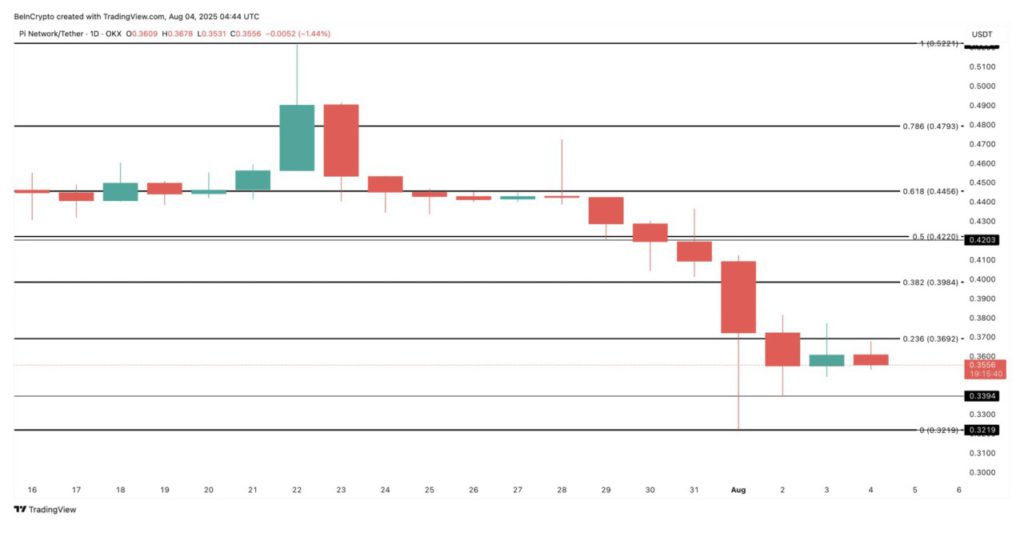
PI Price Needs to Break $0.369 to Confirm Breakout
On August 4, the price of Pi Coin (PI) was moving around $0.35. Based on Fibonacci retracement analysis from the July 22 peak at $0.52 to the July 31 low at $0.32, the next major resistance levels are at $0.36, followed by $0.39, and $0.42.
The first sign of bull control returning will be seen if the price is able to close daily trading above $0.39.
Conversely, if PI breaks below $0.32, the bullish divergence pattern formed will fall, and the bearish trend is likely to continue.
For now, the PI chart still looks heavy. However, for the first time in weeks, there is reason to believe that the direction could start to change.
However, this shift must be supported by an improvement in the RSI-for example, forming a higher high or lower high-as well asa further decrease in selling pressure for the upside potential to be confirmed.
That’s the latest information about crypto. Follow us on Google News to get the latest information about the world of crypto and blockchain technology. Check today‘ s bitcoin price, today’s solana price, pepe coin and other crypto asset prices through Pintu Market.
Enjoy an easy and secure crypto trading experience by downloading Pintu crypto app via Google Play Store or App Store now. Also, get a web trading experience with various advanced trading tools such as pro charting, various types of order types, and portfolio tracker only at Pintu Pro.
*Disclaimer
This content aims to enrich readers’ information. Pintu collects this information from various relevant sources and is not influenced by outside parties. Note that an asset’s past performance does not determine its projected future performance. Crypto trading activities have high risk and volatility, always do your own research and use cold cash before investing. All activities of buying and selling bitcoin and other crypto asset investments are the responsibility of the reader.
Reference:
- BeInCrypto. Pi Coin Price: Bullish Divergence Setup. Accessed on August 5, 2025