Is Altcoin Season Already Over? Ethereum and Bitcoin Charts Flash Warning Signs

Jakarta, Pintu News – As crypto traders begin to look for signs of a new altcoin season, recent market movements and data suggest that the celebration may still be too early.
While many expect the recent surge in altcoin prices to be the start of a new rally, technical signals – notably Bitcoin’s dominance and Ethereum ETF inflows – suggest a different story.
Bitcoin’s Dominance Remains Strong, Bad News for Altcoins
Read also: Bitcoin Hits $114K — Is a Drop to $95K Next, or Will It Rally to $119K?
On the 3-day chart, Bitcoin dominance is still holding above the important support zone between 60.5% to 61%. This is a highlight because when Bitcoin dominance rises or remains stable, it usually signals that funds are still stuck in Bitcoin and have not flowed into altcoins such as Ethereum , Solana , and others.
There was indeed a slight decline in dominance recently, which briefly pushed altcoins up slightly. However, the move was not strong enough to be considered the start of a real altcoin rally.
According to the analyst, as long as Bitcoin’s dominance hasn’t broken this support zone clearly to the downside, hoping that the altcoin will score big gains is still considered risky.
If dominance rises again from this point, the pressure on altcoins could be even heavier.
Ethereum ETF Experiences Worst Day in History
Adding to the concerns over altcoins, Ethereum ETF activity on Wall Street is also showing negative signals.
On Monday (Aug 4), the market recorded massive outflows from spot Ethereum ETFs – more than $465 million was withdrawn in just one day. In fact, BlackRock’s Ethereum ETF recorded $375 million in withdrawals alone.
This has been the worst day in history for the Ethereum ETF, casting fresh doubt on short-term investor confidence and the future direction of the ETH price.
Ethereum Faces Strong Resistance and Bearish Signals
Ethereum price is currently showing signs of weakness. ETH has been rejected several times at the important resistance zone between $3,900 to $4,100.
Read also: Ethereum Edges Up to $2,600 — But Why Are the Big Players Pulling Back?
Every time the price approaches that area, the selling pressure increases and the price drops again. This pattern has happened repeatedly over the past year.
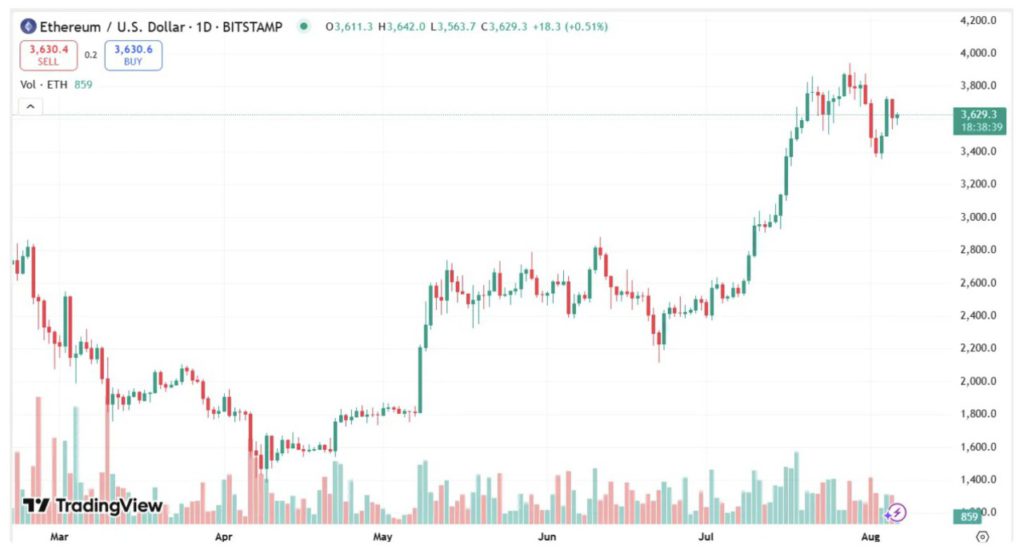
In addition, technical indicators show a bearish divergence on Ethereum’s daily chart – a signal that often indicates a potential price drop. The last time this pattern appeared, the price of ETH dropped in the following weeks.
If the same pattern repeats, a similar downturn could occur again in the near future.
That’s the latest information about crypto. Follow us on Google News to get the latest information about the world of crypto and blockchain technology. Check today‘ s bitcoin price, today’s solana price, pepe coin and other crypto asset prices through Pintu Market.
Enjoy an easy and secure crypto trading experience by downloading Pintu crypto app via Google Play Store or App Store now. Also, get a web trading experience with various advanced trading tools such as pro charting, various types of order types, and portfolio tracker only at Pintu Pro.
*Disclaimer
This content aims to enrich readers’ information. Pintu collects this information from various relevant sources and is not influenced by outside parties. Note that an asset’s past performance does not determine its projected future performance. Crypto trading activities have high risk and volatility, always do your own research and use cold cash before investing. All activities of buying and selling bitcoin and other crypto asset investments are the responsibility of the reader.
Reference:
- Coinpedia. Is Altcoin Season 2025 Over? Ethereum and Bitcoin Charts Hint at Trouble Ahead. Accessed on August 7, 2025


