7 Important Things About the Bitcoin Rainbow Chart: A Color Guide to Assessing BTC Price

Jakarta, Pintu News – The Bitcoin Rainbow Chart is a colored chart that visualizes Bitcoin’s price movements over time, helping investors see if the price is in a cheap or expensive zone.
By dividing the chart into several color bands, the tool gives a simple overview of market sentiment based on historical data, making it suitable for use as an additional guide in crypto investment strategies.
1. What is Bitcoin Rainbow Chart
The Bitcoin Rainbow Chart is a visual chart that uses color gradations to show Bitcoin (BTC) price levels in different phases of market sentiment.
This chart helps investors recognize whether BTC prices are undervalued (cheap) or overvalued (expensive) based on historical trends.
Also Read: 5 Unique Facts Behind Ethereum (ETH) that You Might Not Know About
2. How This Chart Was Created
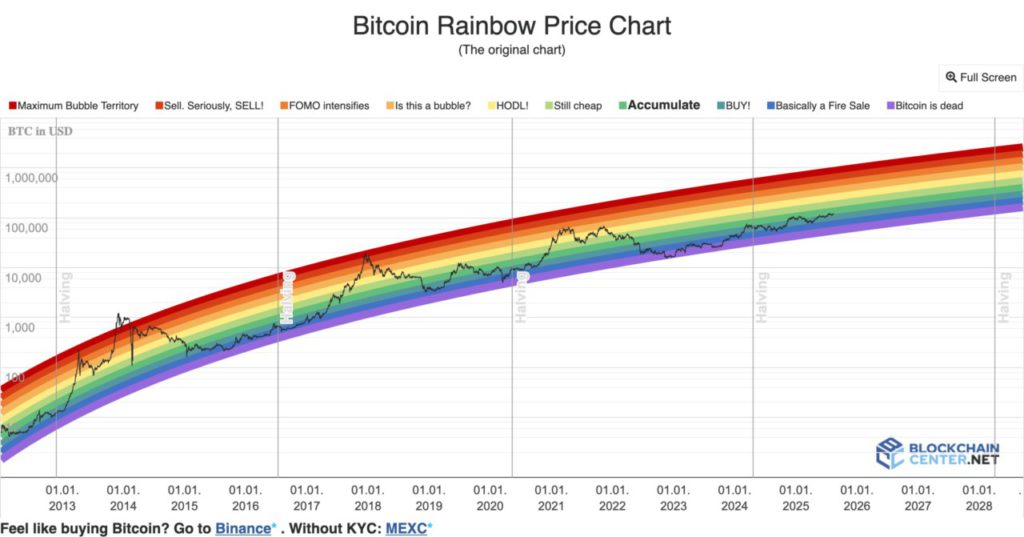
The Rainbow Chart is built from historical Bitcoin price data with a logarithmic regression line to reduce the impact of volatility. The color bands are arranged from red at the top (overvalued) to purple at the bottom (undervalued).
3. Color Meanings on the Rainbow Chart

Each color band depicts the level of market sentiment:
- Red: Very overvalued, prone to price correction.
- Orange: Approaching overbought, need to be cautious.
- Yellow: Neutral, prices are likely to stabilize.
- Green: Undervalued, attractive buying opportunity.
- Blue & Purple: Very undervalued, ideal entry point for the long term.
4. How to Use it for Analysis
Use the Rainbow Chart as an additional guide, not the only indicator.
Take the following steps:
- Monitor the price position of BTC within the color band.
- Compare historical trends with current conditions.
- Combine it with other technical indicators such as RSI or MACD.
5. When Rainbow Chart is Most Useful

This tool is suitable for long-term investors who want to understand Bitcoin market cycles.
It is also suitable for beginners who want to visualize BTC price patterns over a yearly timeframe.
6. Limitations of the Rainbow Chart
While useful, this chart has its downsides:
- Based on historical data, not an exact prediction of the future.
- Does not take into account black swan events.
- Does not replace fundamental analysis.
7. Use with a Complete Strategy
The Bitcoin Rainbow Chart provides an easy-to-understand visual representation of the BTC price. However, for maximum results, combine it with technical analysis, fundamentals, and monitoring crypto market news.
Also Read: 7 Ethereum (ETH) Developments to Anticipate in 2025
Follow us on Google News to get the latest information about the world of crypto and blockchain technology. Check today‘ s bitcoin price, today’s solana price, pepe coin and other crypto asset prices through Pintu Market.
Enjoy an easy and secure crypto trading experience by downloading Pintu crypto app via Google Play Store or App Store now. Also, get a web trading experience with various advanced trading tools such as pro charting, various types of order types, and portfolio tracker only at Pintu Pro.
*Disclaimer
This content aims to enrich readers’ information. Pintu collects this information from various relevant sources and is not influenced by outside parties. Note that an asset’s past performance does not determine its projected future performance. Crypto trading activities are subject to high risk and volatility, always do your own research and use cold hard cash before investing. All activities of buying andselling Bitcoin and other crypto asset investments are the responsibility of the reader.
Reference:
- OSL Academy. What is the Bitcoin Rainbow Chart and How to Use It? Accessed August 14, 2025.