Dogecoin Slips Amid Investor Exodus — Could It Fall Another 15%?
Jakarta, Pintu News – On August 19, the Dogecoin price corrected by 2% in the last 24 hours, making the previous weekly gains disappear and its 7-day performance is now in the negative zone. Several on-chain indicators suggest that the selling pressure on Dogecoin may not be over yet.
In particular, analysis of the two major holder groups as well as supply gains data indicate a possible continuation of the bearish trend. If key support levels are broken, the Dogecoin price has the potential to fall further, and could even decline up to 15% from its current position.
Then, how is the current Dogecoin price movement?
Dogecoin Price Drops 1% within 24 Hours
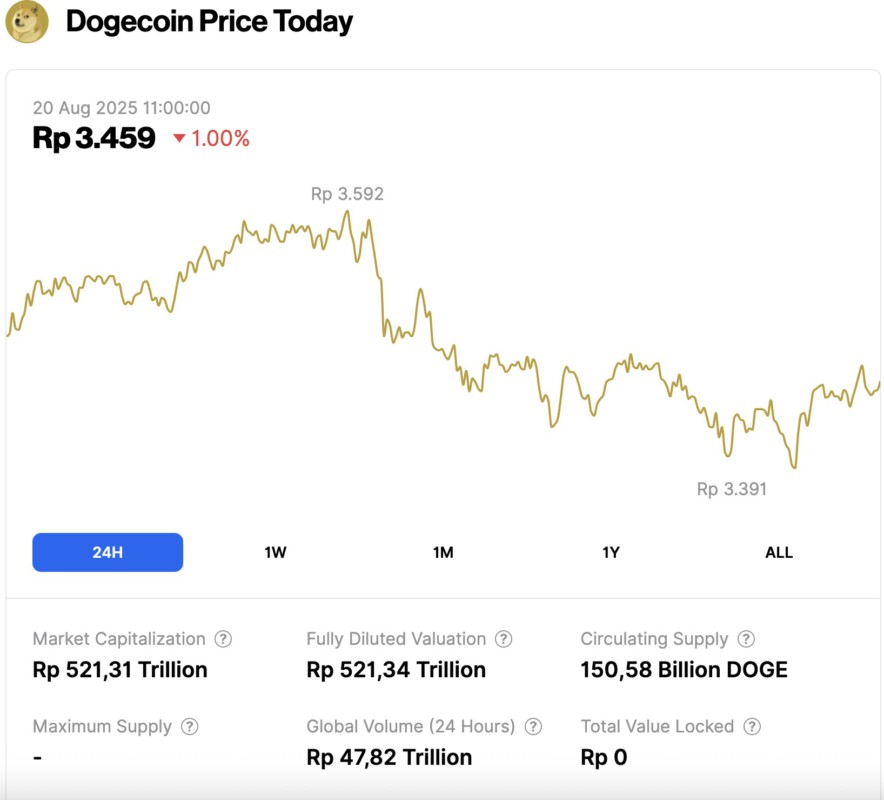
As of August 20, 2025, Dogecoin slipped by 1% over the past 24 hours, trading at $0.2123 (approximately IDR 3,459). Throughout the day, its price fluctuated between IDR 3,391 and IDR 3,592.
At the time of writing, Dogecoin’s market capitalization is estimated at IDR 521.31 trillion, while its 24-hour trading volume has dipped slightly—down 1% to IDR 47.82 trillion.
Read also: Ethereum Price Drops to $4,100 Today as Whales Begin Offloading Assets
Two Major Dogecoin Holder Groups Start Selling
Data from the HODL Waves metric shows that two key groups of Dogecoin holders are now starting to reduce their positions. These groups are:
- 6-12 month holders, whose proportion fell from 15.46% to 14.705% in the past two weeks.
- 1-3 month holders, which experienced a sharper decline from 8.0% to 4.614%.
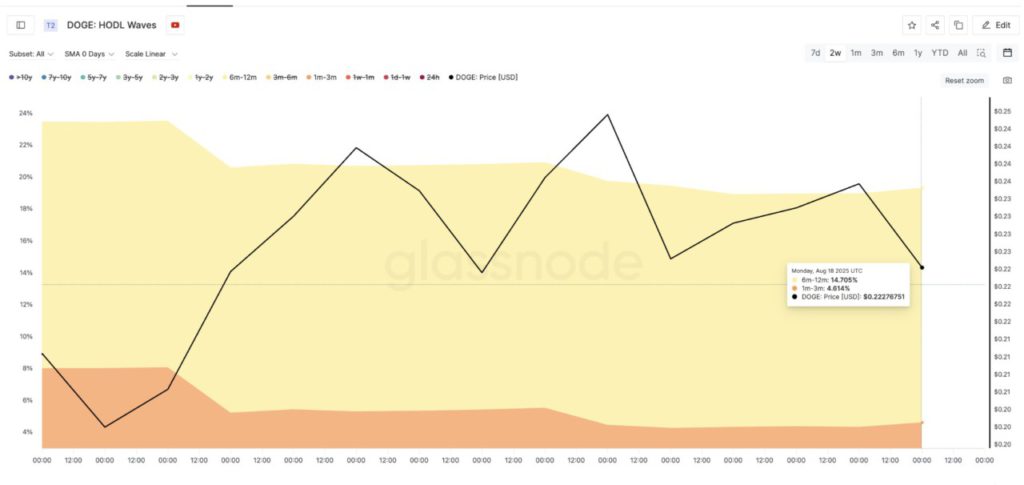
This signals that not only short-term traders are selling, but also medium- and long-term investors are starting to offload their coins. The movement of these two groups is often an indicator of changing sentiment among holders as a whole.
When both reduce exposure simultaneously, it usually means that confidence in the near-term recovery of prices is declining.
More worryingly, this shift happened while prices were falling, not after a rally. This means that these holders are not taking profits, but rather exiting with minimal losses or gains, which could signal fear of a deeper drop.
Waves’ own HODL metric illustrates the distribution of coins by age of ownership, helping to understand how long different groups of holders hold tokens before selling them.
High percentage of coins that are still profitable, this could be a problem
As of August 19, 2025, approximately 76.95% of Dogecoin’s circulating supply was still in profit. Historically, whenever this figure crosses 73%, a price correction usually follows.
The last time this number was at the same level, on July 30, the Dogecoin price was around $0.22. Shortly after, the price dropped to $0.19. During that period, the percentage of supply that was profitable decreased to 61.79%, and it wasn’t until after that drop that the Dogecoin price started to rise again.
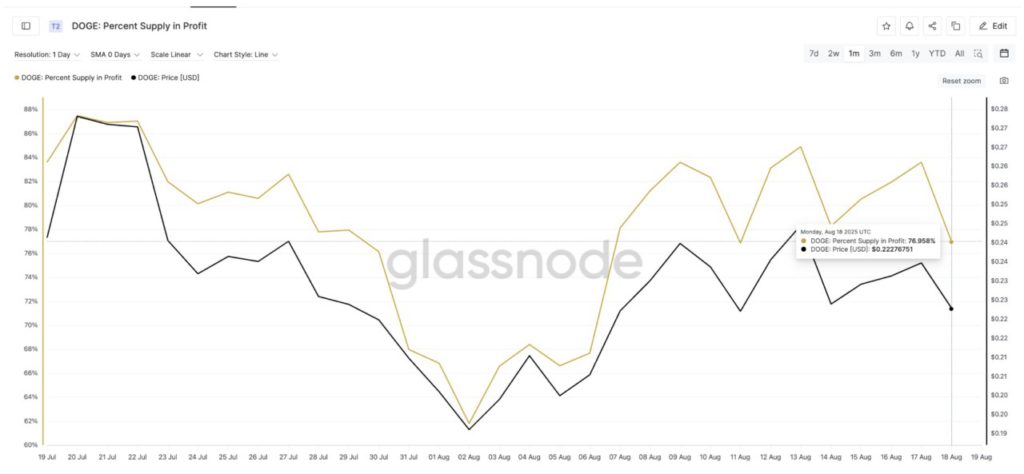
Now, we are in the same 76% range, and the risk of a repeat of that scenario is quite high: the profitable supply needs to come down before buyers come back in. Until then, any price increase will face huge selling pressure.
Read also: Dogecoin Price Outlook: Why $0.20 Could Be the Key Level for the Next Rally
This is also related to the previous HODL Waves data. When the percentage of supply in profit is high and medium to long-term holders start selling, it usually reflects fear of losing profits or anticipation of a deeper drop.
Dogecoin Price Chart and Key Indicators Confirm Bearish Pressure
From a technical perspective, Dogecoin is currently near the critical support level of $0.21. If this level is broken, the market structure will turn decidedly bearish.
The next key support is at $0.20, but the broader bearish target is at $0.18, which means a potential drop of around 15% from the current price.
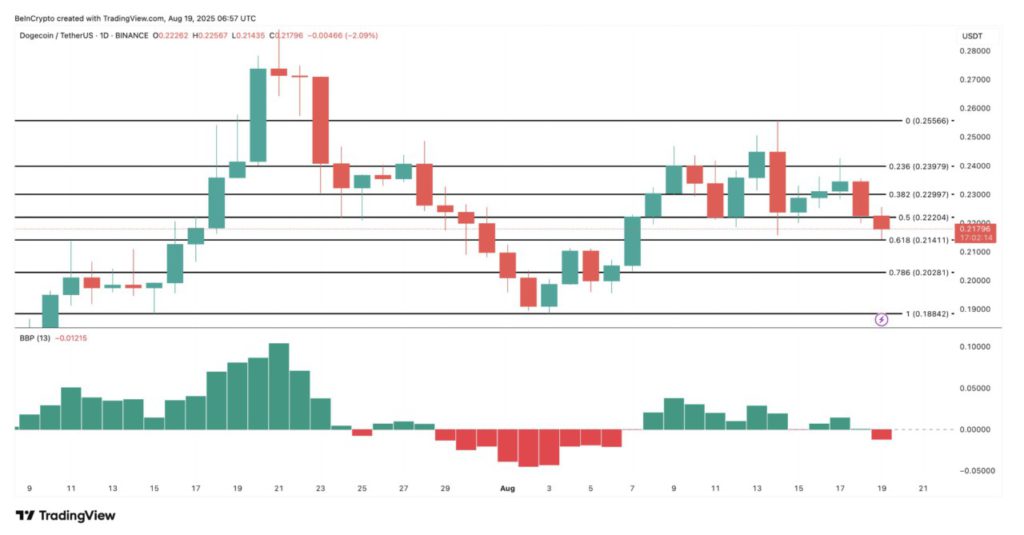
Meanwhile, the Bull and Bear Power (BBP) indicator has turned negative. This signals that selling power has overpowered buying power, in line with on-chain data showing similar behavior: retail investors are selling, while buyers are reluctant to enter.
The BBP indicator, also known as the Elder Ray Index, measures the strength of buyers (bulls) and sellers (bears) by comparing the difference between price extremes and moving averages. This helps identify whether bullish or bearish forces are dominating the market.
A change in momentum is evident. If the $0.21 level fails to hold, a bearish scenario becomes increasingly likely. Conversely, if the Dogecoin price manages to recover and break $0.23, it is likely that the bearish trend will disappear.
That’s the latest information about crypto. Follow us on Google News to get the latest information about the world of crypto and blockchain technology. Check today‘ s bitcoin price, today‘ s solana price, pepe coin and other crypto asset prices through Pintu Market.
Enjoy an easy and secure crypto trading experience by downloading Pintu crypto app through Google Play Store or App Store now. Also, get a web trading experience with various advanced trading tools such as pro charting, various types of order types, and portfolio tracker only at Pintu Pro.
*Disclaimer
This content aims to enrich readers’ information. Pintu collects this information from various relevant sources and is not influenced by outside parties. Note that an asset’s past performance does not determine its projected future performance. Crypto trading activities have high risk and volatility, always do your own research and use cold cash before investing. All activities of buying and selling bitcoin and other crypto asset investments are the responsibility of the reader.
Reference:
- BeInCrypto. Dogecoin at Risk of 15% Drop as Key Cohorts Exit. Accessed on August 20, 2025