10 Crypto Chart Patterns to Analyze Price Movement in 2025
Jakarta, Pintu News – Cryptocurrency chart patterns provide very important visual insights for traders in analyzing price movements in the crypto market.
Combining this pattern with candlestick trading techniques allows traders to identify market sentiment, whether it is bullish, bearish, or neutral.
These patterns often indicate the next direction of the market, which can provide opportunities to make more informed trading decisions.
Here are 10 crypto chart patterns that can help improve traders’ trading strategies in 2025 according to Coingape.
1. Head and Shoulders (H&S) Pattern
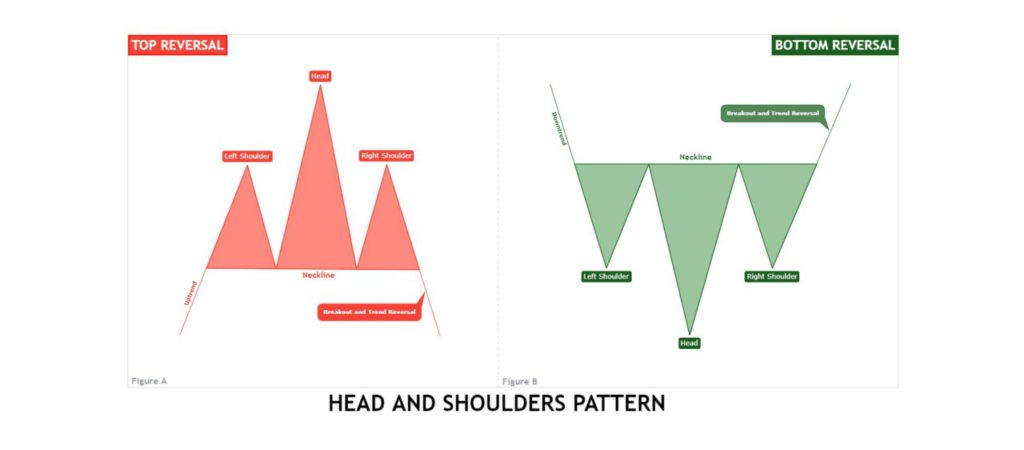
The Head and Shoulders pattern is one of the most well-known trend reversal patterns. It forms when the price of a crypto reaches a higher peak (head) and then drops back to the starting point of the previous trend.
The other two peaks (shoulders) are around almost the same level. This pattern indicates a possible trend reversal from bullish to bearish, which signals to sell.
Traders can identify this pattern through the neckline, which becomes the confirmation level. A breakout from the neckline indicates the possibility of a significant price reversal, with a profit target that can be calculated based on the difference between the breakout price and the highest or lowest point of the pattern.
2. Falling Wedge Pattern
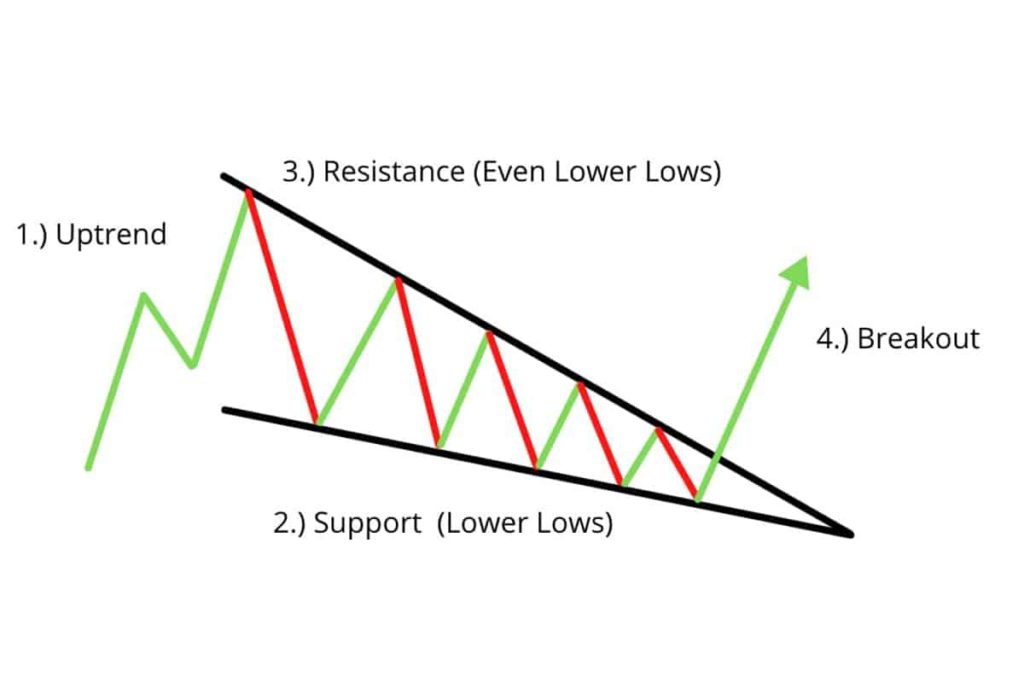
The Falling Wedge pattern is a bullish pattern that forms when the price drops and forms a “cone” with a downward slope. It indicates a potential trend reversal after the price has decreased. Regardless of whether this pattern is a reversal or a continuation, the Falling Wedge signals the possibility of a strong price increase in the near future.
This pattern is often an excellent signal to buy crypto as the price will start moving up after the formation of this pattern. Traders should wait for confirmation of the breakout before taking action.
3. Rising Wedge Pattern
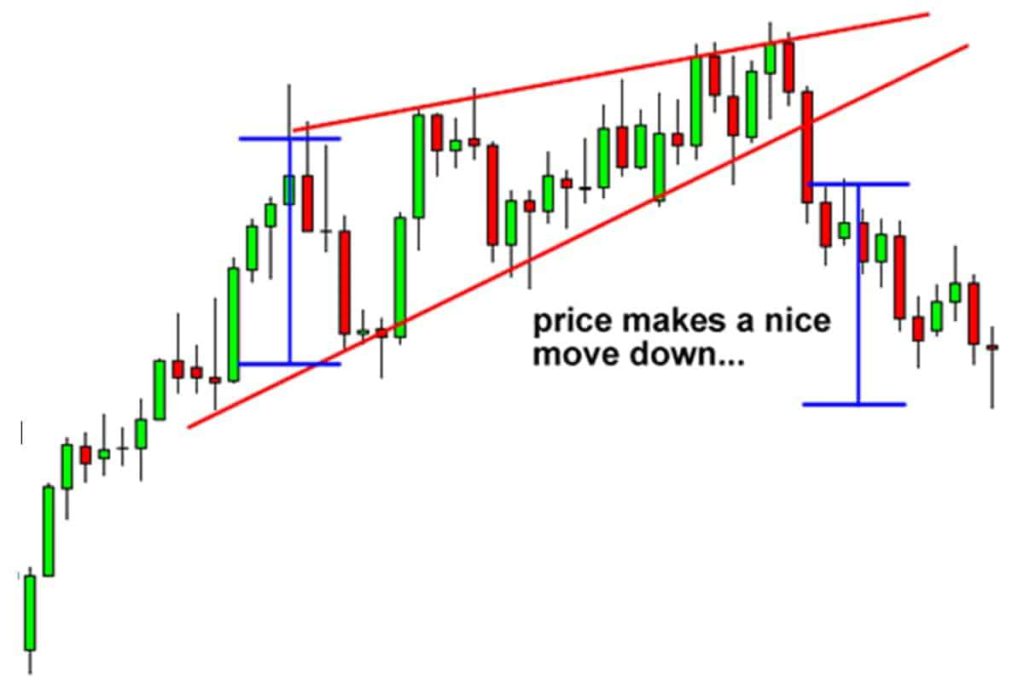
Unlike the Falling Wedge, the Rising Wedge is a bearish pattern that occurs when the price moves up but with a narrowing range. This pattern shows that although the price is rising, the momentum is weakening. Usually, this pattern ends with a downward trend reversal.
Read also: Survey: Generation X and Baby Boomers Now Leading Crypto Adoption
The Rising Wedge pattern generally indicates a potential price drop, although it can also sometimes appear in a trend continuation pattern. Traders should be careful in analyzing this pattern, as it can be a sign of diminishing strength of the uptrend.
4. Flag Pattern
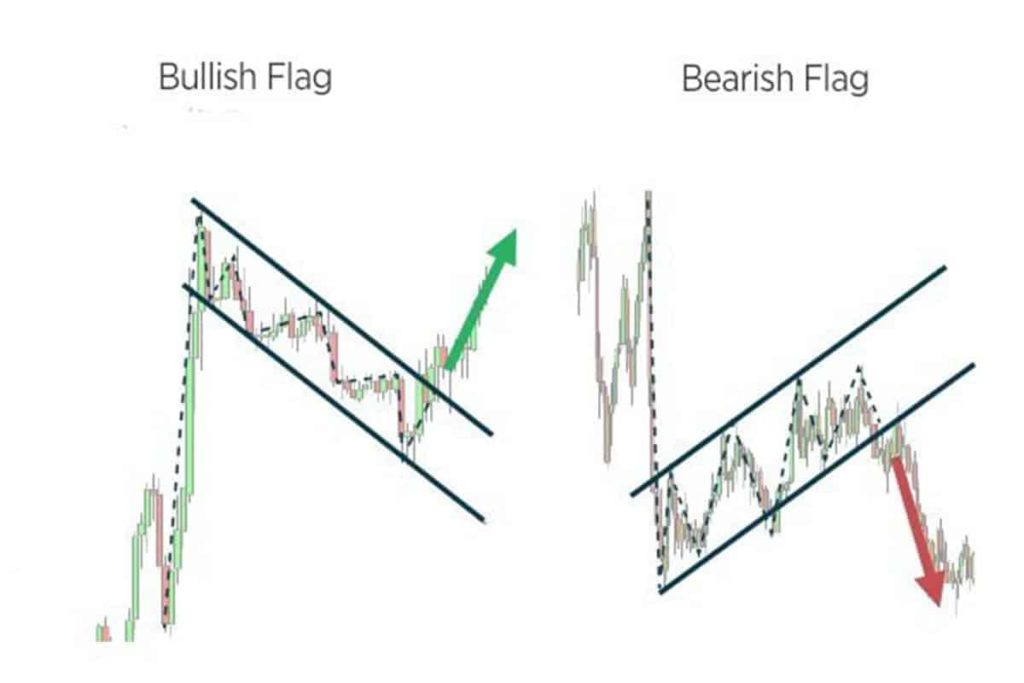
A Flag pattern is a continuation pattern that forms after a sharp price movement, usually followed by consolidation in the form of a small box (flag). The flag indicates that the market is taking a short break before resuming the main trend movement.
If the price breaks the upper limit of the Flag pattern, it indicates a buy signal, while a downward break is a sell signal. This pattern often occurs after a significant price movement, be it up or down, and is a good indicator to gauge trend continuation.
5. Double Top and Double Bottom Pattern
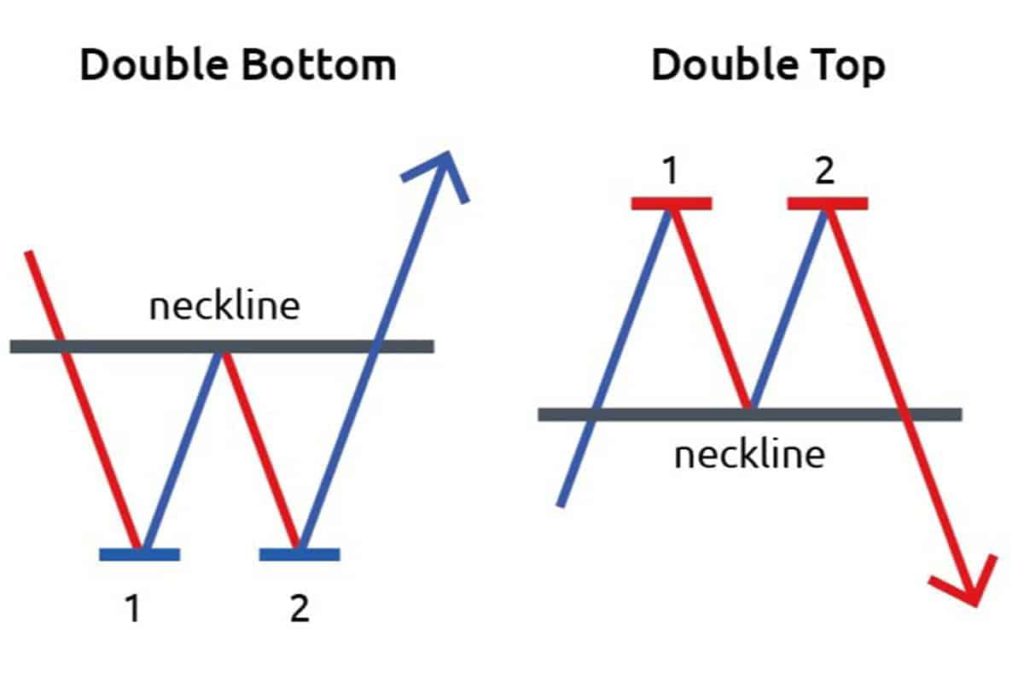
The Double Top pattern is a bearish reversal pattern that forms after a crypto price has experienced a significant rise, then forms two peaks with a retracement between them. This pattern indicates that the uptrend has ended and the market could potentially move down.
On the contrary, the Double Bottom Pattern is a bullish reversal pattern that forms after a significant price drop, where the price reaches two lows before reversing. Both of these patterns are very useful patterns for identifying potential changes in market direction.
6. Triple Top and Triple Bottom Pattern
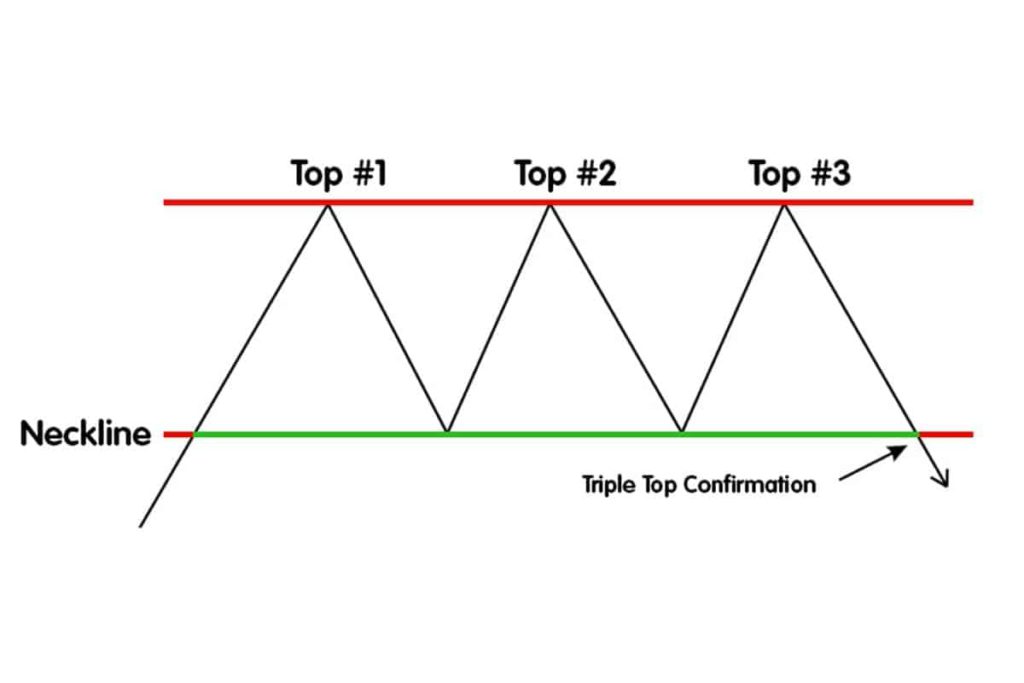
The Triple Top pattern is a bearish pattern that forms when the price tests the same resistance level three times, but fails to break it. This indicates that the buying pressure is starting to weaken and the potential for a downward price reversal is growing.
On the contrary, a Triple Bottom is a bullish pattern that occurs when the price tests the same support level three times and fails to break it, indicating a potential reversal to the upside.
Also read: Will the XRP ETF be approved by the SEC? Here are the facts!
This pattern usually has a longer time gap between its peaks or troughs, and the volume tends to decrease as the pattern progresses, indicating less buying pressure before the market finally moves in the opposite direction.
7. Ascending Triangle Pattern
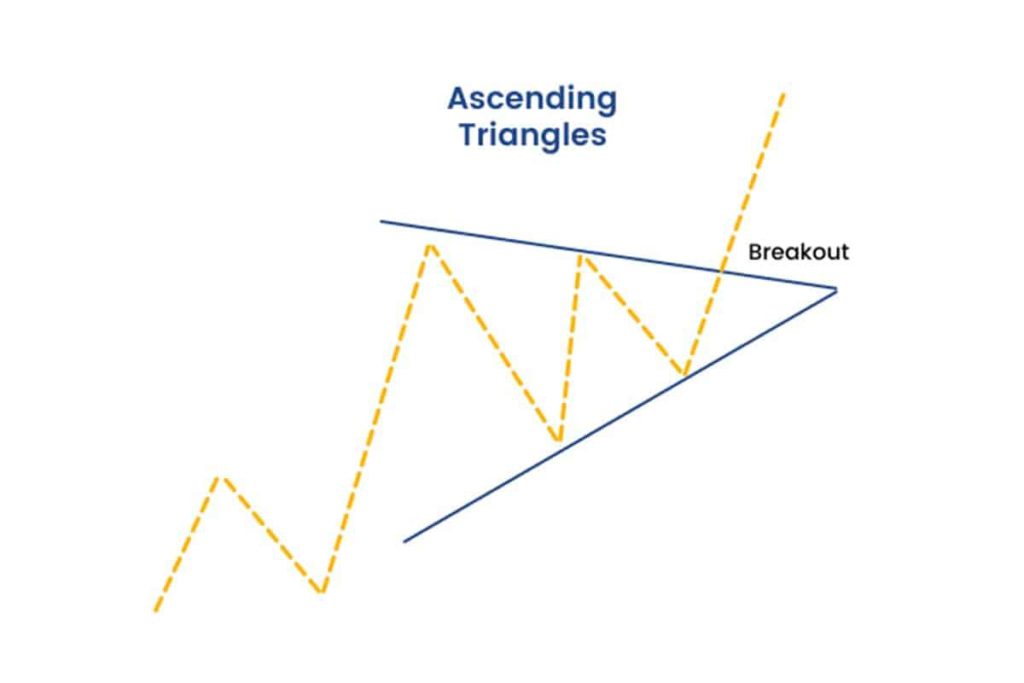
The Ascending Triangle pattern is a continuation pattern that forms when the price moves to form an uptrend line from the downside and a horizontal resistance level from the upside. This pattern suggests that the price may continue to move up after the breakout of the resistance level.
Traders usually see this pattern as an indication of the continuation of an ongoing bullish trend. When the price breaks out of the resistance level, the market will most likely continue the previous uptrend.
8. Channel Up and Channel Down Pattern
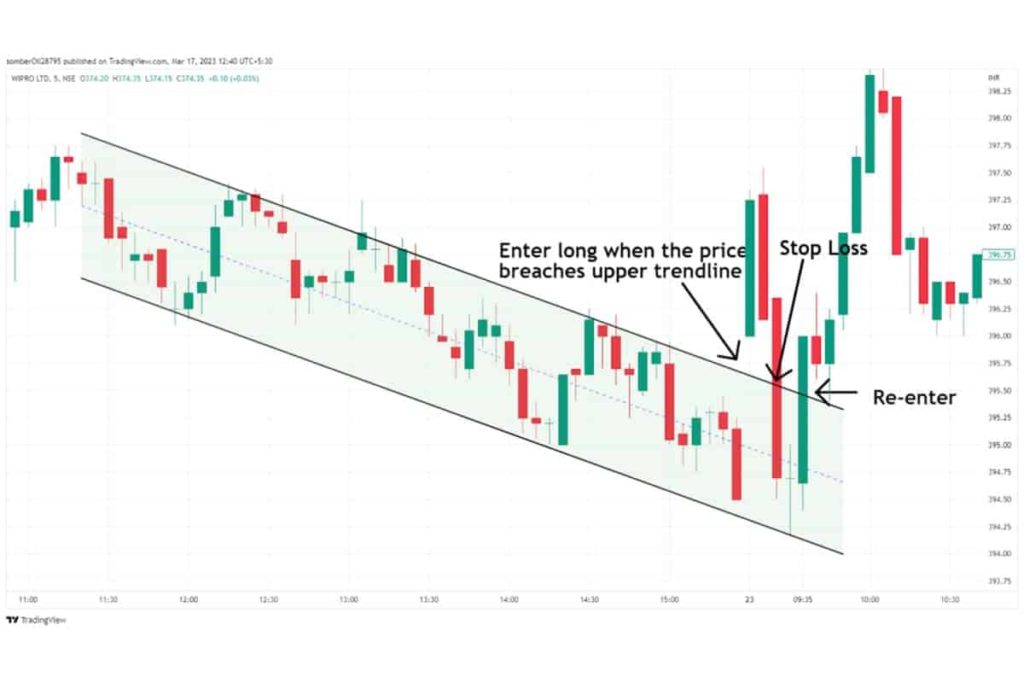
The Channel Up pattern forms when the price moves within an increasing range, with two parallel trend lines forming the upper and lower boundaries. This pattern indicates a continuing uptrend as long as the price stays within the channel.
Conversely, a Down Channel is formed when the price moves in a decreasing range, indicating that the market is in a downtrend. Breakouts from these two channels can provide important signals to determine the next direction of the market.
9. Rectangle Pattern
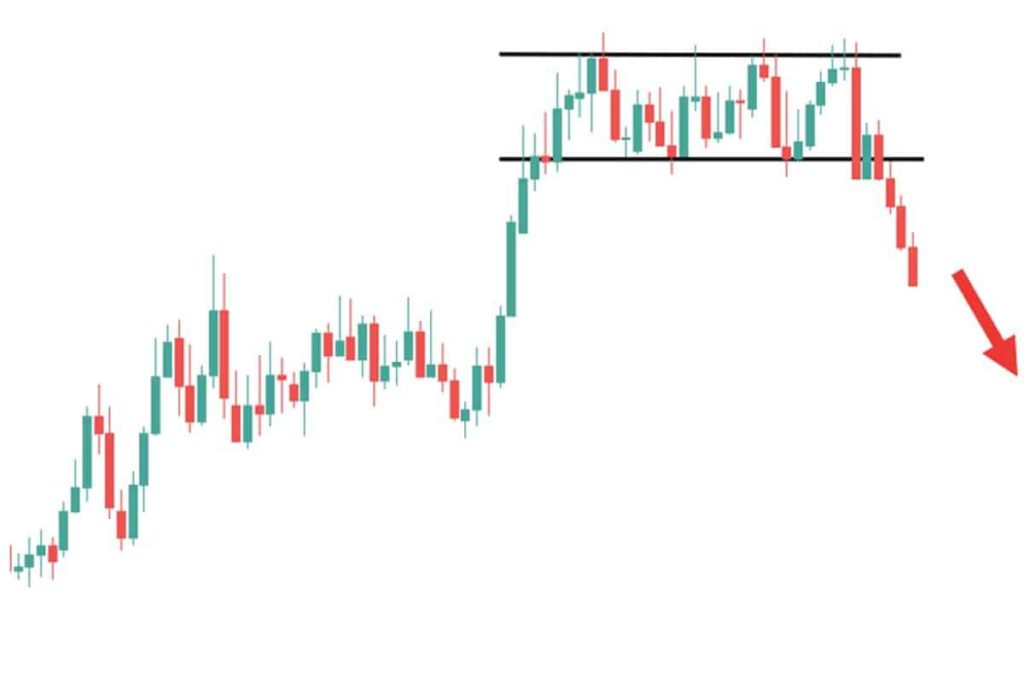
The Rectangle pattern occurs when the price moves within a relatively horizontal price range over a longer period. This pattern indicates that the market is moving sideways before resuming the previous trend. If the price breaks out of the upper limit of the pattern, it’s a buy signal, while a downward breakout is a sell signal.
The Rectangle pattern is very useful in identifying breakout points, which can help traders determine the best time to enter or exit the market.
10. Breakout and Retest Patterns
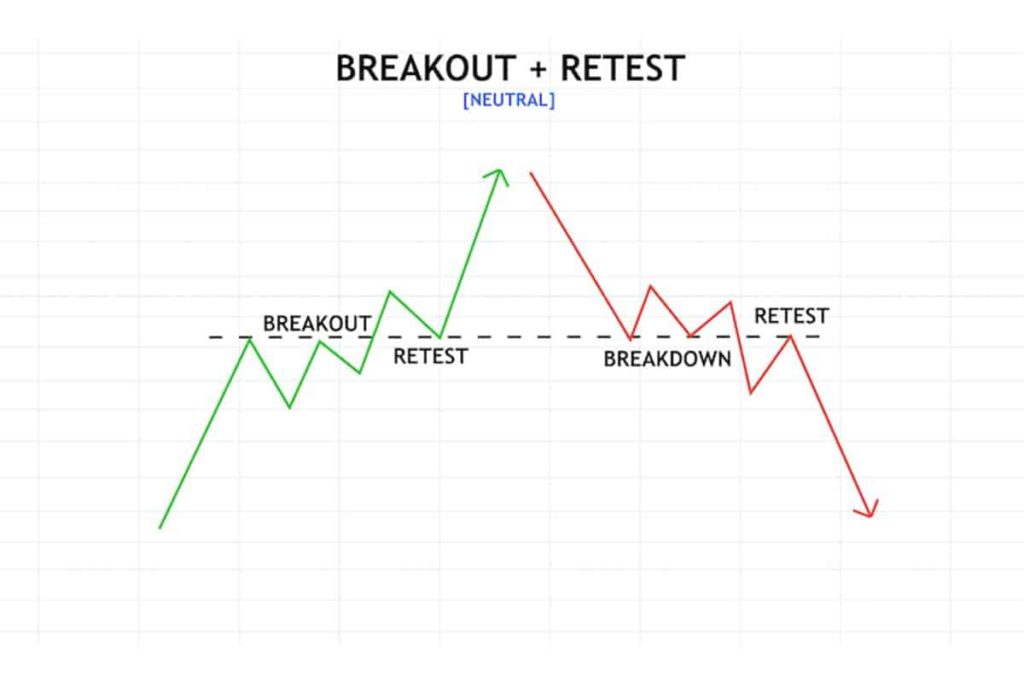
Breakout and Retest patterns occur when the price breaks out of a strong support or resistance level, then returns to test that level after the breakout.
This pattern signals that the previously existing trend will continue if the price confirms the reversal by returning to the broken support or resistance level.
This pattern is especially useful for beginner traders as it provides a clear entry point to take a position once the breakout is confirmed.
That’s the latest information about crypto. Follow us on Google News to get the latest crypto news about crypto projects and blockchain technology. Also, learn crypto from scratch with complete discussion through Pintu Academy and stay up-to-date with the latest crypto market such as bitcoin price today, xrp coin price today, dogecoin and other crypto asset prices through Pintu Market.
Enjoy an easy and secure crypto trading experience by downloading Pintu crypto app through Google Play Store or App Store now. Also, get a web trading experience with various advanced trading tools such as pro charting, various types of order types, and portfolio tracker only at Pintu Pro.
*Disclaimer
This content aims to enrich readers’ information. Pintu collects this information from various relevant sources and is not influenced by outside parties. Note that an asset’s past performance does not determine its projected future performance. Crypto trading activities have high risk and volatility, always do your own research and use cold cash before investing. All activities of buying and selling bitcoin and other crypto asset investments are the responsibility of the reader.
Reference:
- Coingape. 10 Crypto Chart Patterns to Elevate Your Trading. Accessed August 31, 2025
- Featured Image: KuCoin


