Will Solana (SOL) Decline in September?
Jakarta, Pintu News – In September, the Solana cryptocurrency showed several indicators that could affect its performance. Based on recent data, there are several factors that may trigger Solana (SOL) price movements that investors and market watchers should be aware of.
Check out the full analysis in this article!
Percentage of Favorable Supply Approaches Six-Month Peak
One of the important metrics in Solana’s (SOL) analysis is the percentage of favorable supply. This metric reached a six-month peak on August 28 with 96.56% before declining slightly to around 90%. History shows that peaks like this are often followed by a correction in Solana (SOL) prices.
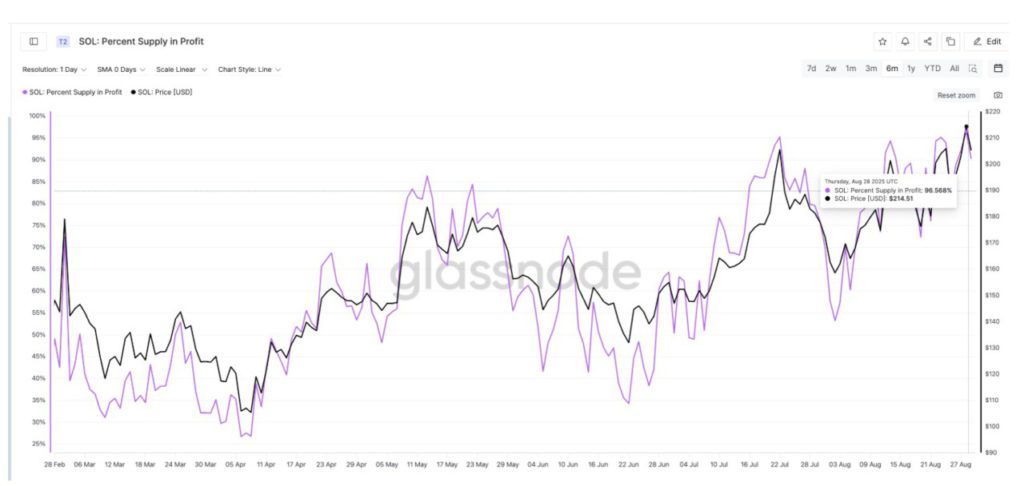
On July 13, when this metric hit 96%, the price of Solana (SOL) was around $205, but then dropped by 23% to $158. On August 13, this metric reached 94.31%, which triggered a 12% correction from $201 to $176.
Then, on August 23, another peak at 95.13% led to an 8% drop from $204 to $187. With this metric back near record highs, the risk of a deeper correction in Solana (SOL) prices in September is increasing.
Read also: 5 Best Tablets for Beginner and Professional Crypto Traders
Balance on Exchange Indicates Sales Risk
The risk of such a sale was reinforced by the Solana (SOL) balance on the exchange. The amount of Solana (SOL) held on the central exchange jumped to more than 32 million tokens on August 28, up from less than 30 million at the beginning of the month.
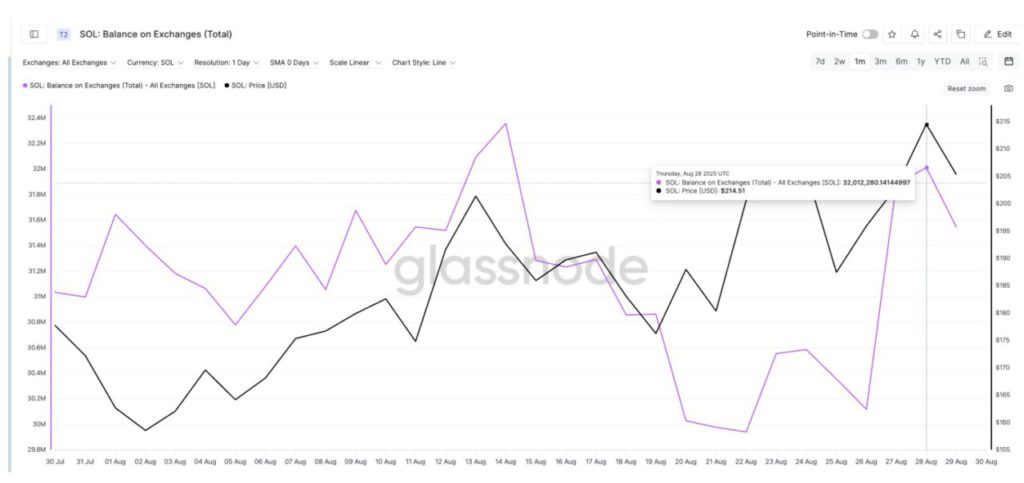
A rising balance usually indicates that holders are ready to sell. The correlation was clear on August 14, when the balance peaked above 32 million, the price of Solana (SOL) fell 8% from $192 to $176 within a few days.
Now, with balances rising again, a similar scenario is forming, suggesting downward pressure that could affect Solana (SOL) prices in September.
Also read: 3 Most Anticipated Crypto Airdrops in September 2025
Solana (SOL) Price Policy Shows Bearish Setup Despite Positive History
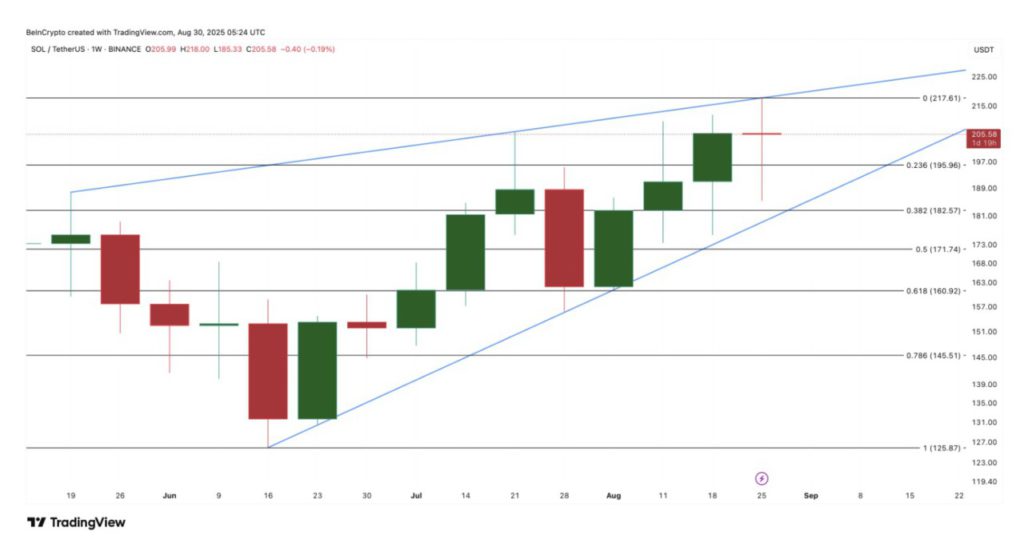
On the technical front, a bearish setup is also evident. Solana (SOL) is moving in a rising wedge pattern on the weekly chart – a pattern that often signals weakening momentum and could lead to a bearish continuation or reversal.
If Solana (SOL) price loses support at $195 and $182, the decline could continue up to $160, marking another potential pullback of 15-20%. A break below $182 would even validate the bearish pattern’s collapse. However, there is still a chance for the bulls to regain strength.
A weekly close above $217 – the last local peak – would thwart the bearish implications of the wedge and open the way to higher targets. Until then, the bias is likely to be to the downside.
Conclusion
While Solana (SOL) has a history of positive September performance since 2021 with gains of 29%, 5.3%, 8.2%, and 12.5%, 2025 may be the year that this trend is interrupted. Unless Solana (SOL) manages to close decisively above $217, September prices may struggle, despite the positive boost from historical performance and ETF-related optimism.
That’s the latest information about crypto. Follow us on Google News to get the latest crypto news about crypto projects and blockchain technology. Also, learn crypto from scratch with complete discussion through Pintu Academy and stay up-to-date with the latest crypto market such as bitcoin price today, xrp coin price today, dogecoin and other crypto asset prices through Pintu Market.
Enjoy an easy and secure crypto trading experience by downloading Pintu crypto app via Google Play Store or App Store now. Also, get a web trading experience with various advanced trading tools such as pro charting, various types of order types, and portfolio tracker only at Pintu Pro.
*Disclaimer
This content aims to enrich readers’ information. Pintu collects this information from various relevant sources and is not influenced by outside parties. Note that an asset’s past performance does not determine its projected future performance. Trading crypto carries high risk and volatility, always do your own research and use cold hard cash before investing. All activities of buying and selling bitcoin and other crypto asset investments are the responsibility of the reader.
Reference
- BeInCrypto. Solana Price in September: Outlook. Accessed on September 1, 2025
- Featured Image: DL News


