Ethereum (ETH) Faces Hurdles in September 2025, Can it Surge Again?

Jakarta, Pintu News – Ethereum’s price recovery seems to be starting to show signs of life after falling to the $4,220 zone, similar to Bitcoin’s movement. Now, ETH has broken through several resistance levels, but challenges still lie ahead.
Ethereum Price Recovery: A New Hope
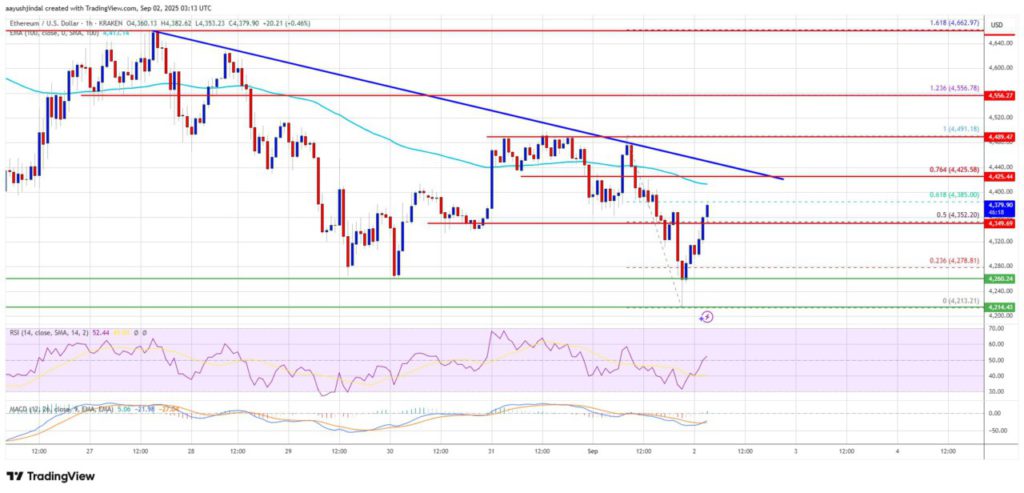
After bottoming out at $4,220, Ethereum (ETH) started showing signs of recovery. The price managed to cross the $4,280 and $4,320 resistances, and surpassed the 50% Fibonacci retracement level of the last decline that started from the high of $4,491 to the low of $4,213.
Currently, Ethereum seems to be forming a base above the $4,200 level, although the pressure from sellers is still quite strong above the $4,400 zone. Currently, Ethereum price is below $4,450 and the 100-hour simple moving average.
Additionally, there is a key bearish trend line with resistance at $4,430 on the hourly chart of ETH/USD. If Ethereum can break this resistance, there is potential to reach $4,500, which could open up further upside opportunities towards $4,550 or even $4,580 in the near future.
Also Read: 5 Facts about Metaplanet’s Crypto Strategy: Save 20,000 BTC Even if the Stock Price Plummets!
Potential Critical Barriers and Resistance
On the upside, Ethereum may face resistance near the $4,385 level, which is the 61.8% Fibonacci retracement of the last decline. The next key resistance is near the $4,400 level and the said trend line.
The first major resistance is at $4,430. If Ethereum manages to cross the $4,430 resistance, it could push the price towards $4,500. An increase above the $4,500 resistance could trigger further gains in the coming sessions. However, if Ethereum fails to break $4,430, the price could drop again.
Ethereum Price Drop Possible
If Ethereum does not manage to break the $4,430 resistance, the price may continue to fall. Initial support on the downside is near the $4,320 level. The first major support lies in the $4,250 zone. If the price moves below the $4,250 support, it could push Ethereum to the $4,200 support. A further drop might send the price towards the $4,160 support level in the near future.
Key Technical and Support Indicators
The hourly MACD indicator for ETH/USD is gaining momentum in the bullish zone. Meanwhile, the hourly RSI (Relative Strength Index) for ETH/USD is now above the 50 zone. The key support is currently at $4,250, while the key resistance is $4,430. These two levels will be very important in determining the direction of Ethereum’s price movement in the near future.
Conclusion
Although Ethereum is showing signs of recovery, there are still some hurdles to overcome. The ability to break through key resistances will largely determine whether Ethereum can continue its upward trend or not. Investors and traders should constantly monitor technical indicators and support and resistance levels to make informed decisions.
Also Read: Check out 4 US Economic Data that Potentially Affect the Crypto Market This Week!
Follow us on Google News to get the latest information about the world of crypto and blockchain technology. Check today‘ s bitcoin price, today’s solana price, pepe coin and other crypto asset prices through Pintu Market.
Enjoy an easy and secure crypto trading experience by downloading Pintu crypto app via Google Play Store or App Store now. Also, get a web trading experience with various advanced trading tools such as pro charting, various types of order types, and portfolio tracker only at Pintu Pro.
*Disclaimer
This content aims to enrich readers’ information. Pintu collects this information from various relevant sources and is not influenced by outside parties. Note that an asset’s past performance does not determine its projected future performance. Crypto trading activities are subject to high risk and volatility, always do your own research and use cold hard cash before investing. All activities of buying andselling Bitcoin and other crypto asset investments are the responsibility of the reader.
Reference
- NewsBTC. Ethereum Recovery Could Face Hurdles Towards $4,500. Accessed on September 3, 2025


