Bitcoin Price Slips to $112,000 Today: Here’s Why It Crashed

Jakarta, Pintu News – As reported by CCN (22/9), since September 18, the price of Bitcoin has continued to decline, even plummeting in today’s “flash crash” to below $112,000.
Although the price has now recovered slightly, the decline casts doubt on the strength of the rally that began on September 1.
BTC is currently at an important support level, and the next move could determine the direction of the market until the end of September. Let’s take a closer look at the chart to see what the next move might be.
Bitcoin Price Drops 2.62% in 24 Hours
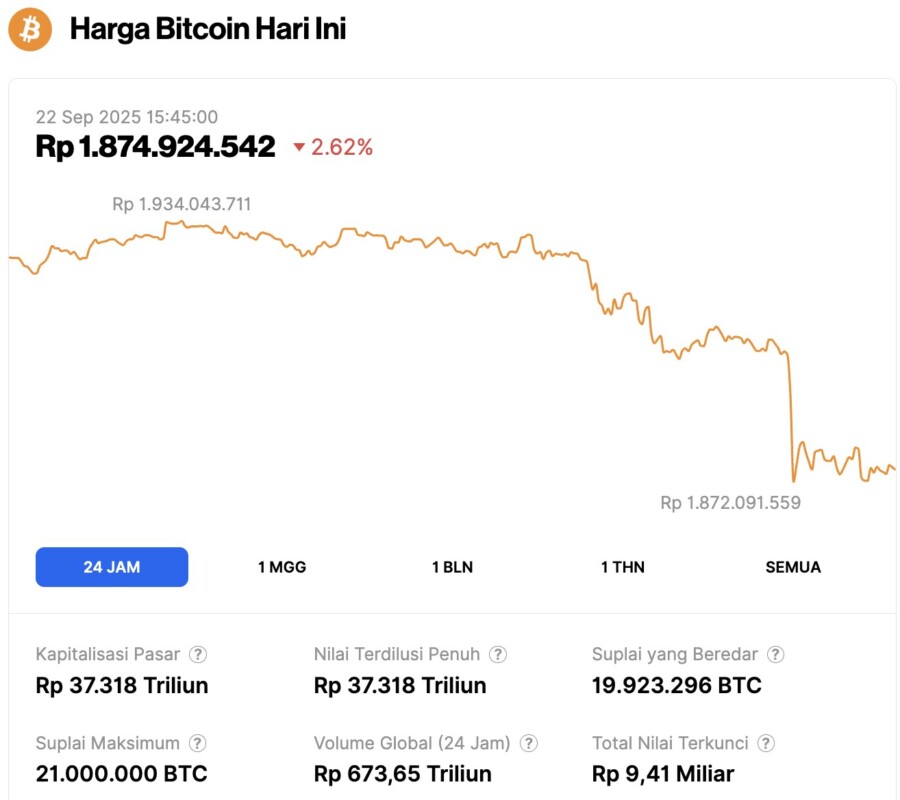
On September 22, 2025, Bitcoin was trading at $112,825 (around IDR 1.87 billion), marking a 2.62% drop over the past 24 hours. Within the same period, BTC hit a daily low of IDR 1.87 billion and climbed as high as IDR 1.93 billion.
At the time of writing, Bitcoin’s market capitalization is estimated at IDR 37,318 trillion, while its 24-hour trading volume surged by 114% to IDR 673.65 trillion.
Read also: Why the Crypto Market Crashed Today, September 22, 2025
Bitcoin’s Fall in September
On the daily chart (22/9), it can be seen that the price of Bitcoin has fallen by more than 4% since its peak at $117,900 on September 18 (red icon). This decline started from an important level, as Bitcoin was rejected at the strong resistance area which is in the range of $117,000-$118,000.
Failure to break out of the area is a negative signal, as it indicates that BTC’s rise is likely just a corrective phase, rather than an impulsive move. Also, the price movement since the September 1 low has been inside an ascending parallel channel pattern, which usually signals a corrective movement.
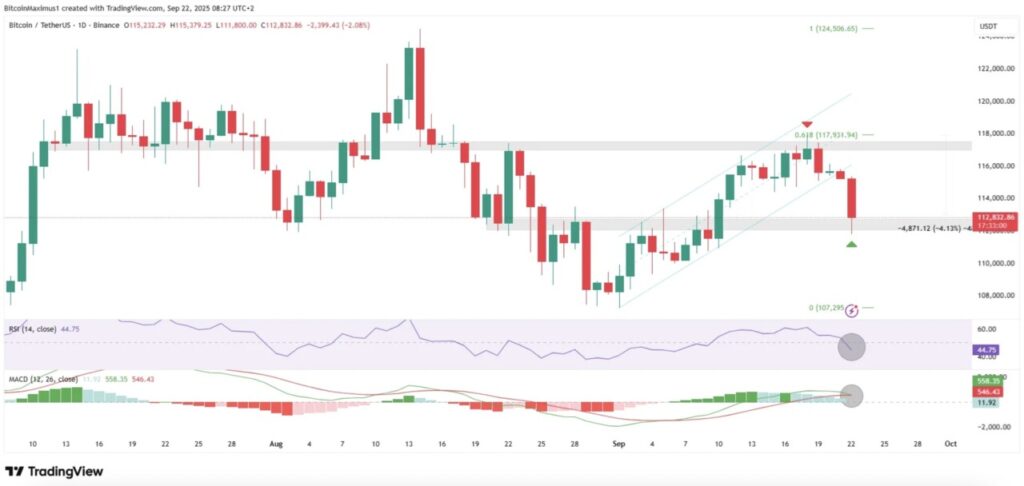
However, the price did bounce off the horizontal support area at $112,000 and potentially formed a long lower tail on today’s candlestick (green icon).
The momentum indicators are also showing worrying signs. The Relative Strength Index (RSI) dropped below the 50 level (black circle), while the Moving Average Convergence Divergence (MACD) formed a bearish crossover.
Overall, the daily chart is still bearish, although the price position in the support area provides an opportunity for a bounce.
Why is Bitcoin Plummeting?
According to CCN’s report, Bitcoin price has the potential to take two different paths until the end of September: a bearish scenario and a bullish scenario.
In this scenario, the price decline is expected to continue throughout September. Based on the calculations, the parallel channel formed is wave B in the A-B-C correction pattern .
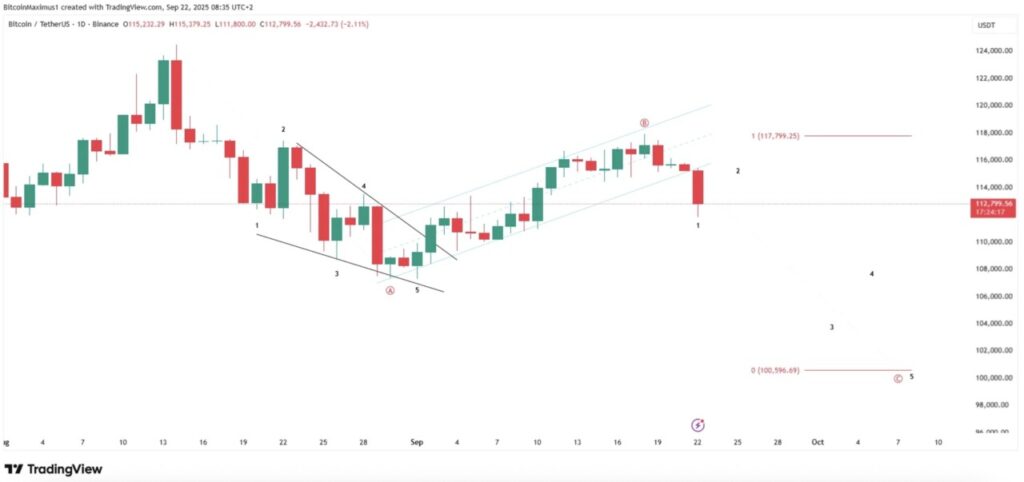
If this calculation is correct, then Bitcoin is currently in wave C of correction, which could push the price down to $100,600. This target is determined by equalizing the lengths of waves A and C. Sub-waves A and C are marked in black.
Although bearish is the main calculation, bullish opportunities are still open. The bullish count suggests that since September 1, Bitcoin has completed a five-wave bullish pattern (green), and is now undergoing an A-B-C correction.
Read also: 3 Altcoins Brace for Token Unlocks in the Wake of Fed’s Rate Cut — Can Bulls Hold the Line?
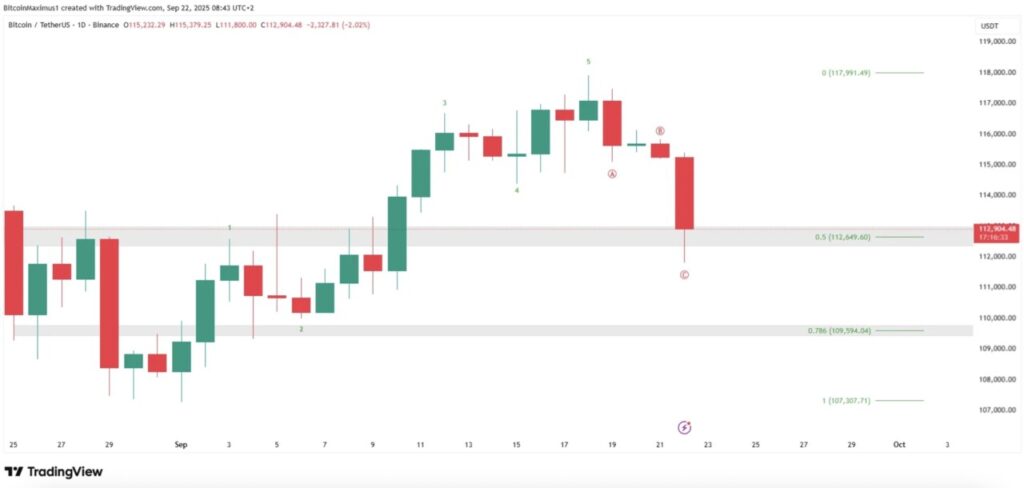
For this scenario to be valid, the price needs to stay above both the horizontal and Fibonacci support levels at $112,650. If it is able to hold, the chances of a rebound will be greater.
However, if the price drops to $109,600 before bouncing, it means that a deeper retracement is occurring. The longer BTC stays below $114,000, the lesser the chances of this bullish scenario materializing.
Conclusions:
- Bearish: BTC could drop to $100,600 if wave C continues.
- Bullish: BTC needs to hold above $112,650 to open up bounce opportunities.
Breakdown or Bounce?
Overall, the rejection of Bitcoin price at the $117,000 resistance area as well as the price’s exit from the up channel put immense pressure on the bullish side.
The momentum indicators are currently leaning more towards a bearish direction. However, the price is right at a crucial support level which, if it is able to hold, could trigger a bounce.
The next few days will be decisive: whether BTC will continue to slide towards $100,000 or start to bounce back.
That’s the latest information about crypto. Follow us on Google News to get the latest crypto news about crypto projects and blockchain technology. Also, learn crypto from scratch with complete discussion through Pintu Academy and stay up-to-date with the latest crypto market such as bitcoin price today, xrp coin price today, dogecoin and other crypto asset prices through Pintu Market.
Enjoy an easy and secure crypto trading experience by downloading Pintu crypto app via Google Play Store or App Store now. Also, get a web trading experience with various advanced trading tools such as pro charting, various types of order types, and portfolio tracker only at Pintu Pro.
*Disclaimer
This content aims to enrich readers’ information. Pintu collects this information from various relevant sources and is not influenced by outside parties. Note that an asset’s past performance does not determine its projected future performance. Trading crypto carries high risk and volatility, always do your own research and use cold hard cash before investing. All activities of buying and selling bitcoin and other crypto asset investments are the responsibility of the reader.
Reference:
- CCN. Bitcoin (BTC) Price Crashes to $112,000 – A Breakdown of the Carnage Unfolding. Accessed on September 22, 2025