How to Read Crypto Charts?
Jakarta, Pintu News – Reading crypto charts is an essential foundational skill for anyone looking to understand the market movements of digital assets. Charts display price and volume changes over time, helping traders recognize trends, patterns, and potential buy and sell points. By understanding how to read charts, one can make more measured and data-driven trading decisions, rather than just speculation.
Why Need to Understand Crypto Charts?
The ability to read charts is one of the basic skills for anyone interested in the cryptocurrency market, whether for investment or short-term trading. Charts help to visually display price movements, making it easier to analyze market trends and make decisions.
By studying price movement patterns, one can identify whether the market is trending up(bullish) or down(bearish). This understanding can help determine a more appropriate time to buy or sell digital assets, as well as design risk management strategies such as stop-loss and take-profit.
Reading crypto charts can be likened to reading a map before going on a trip. While maps help indicate directions and potential obstacles, charts provide guidance on price direction and potential trend changes. However, this skill cannot be acquired instantly – it takes practice and experience in understanding market data and patterns.
Read also: 3 Altcoins that Have a Chance to Reach ATH in Early October 2025
Types of Crypto Graphics
When opening a trading platform such as Binance, Bybit, or TradingView, there are several types of charts that are commonly used. Each has different functions and levels of detail:
1. Line Chart
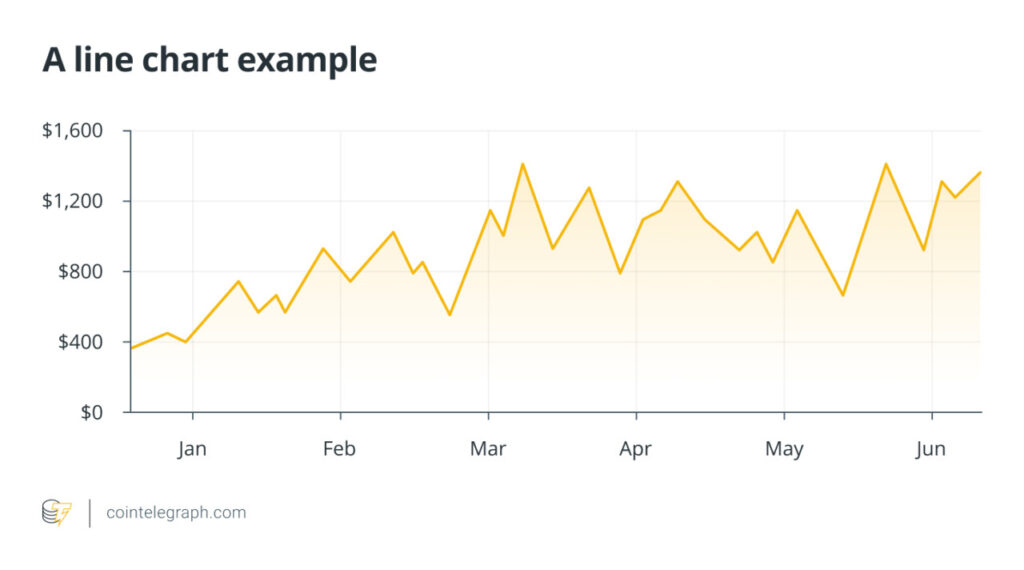
A line chart connects theclosing price from one period to the next. It’s simple and easy to read, perfect for spotting long-term trends. However, it does not display detailed information such as the opening price or the highest and lowest points in a period.
2. Bar Chart
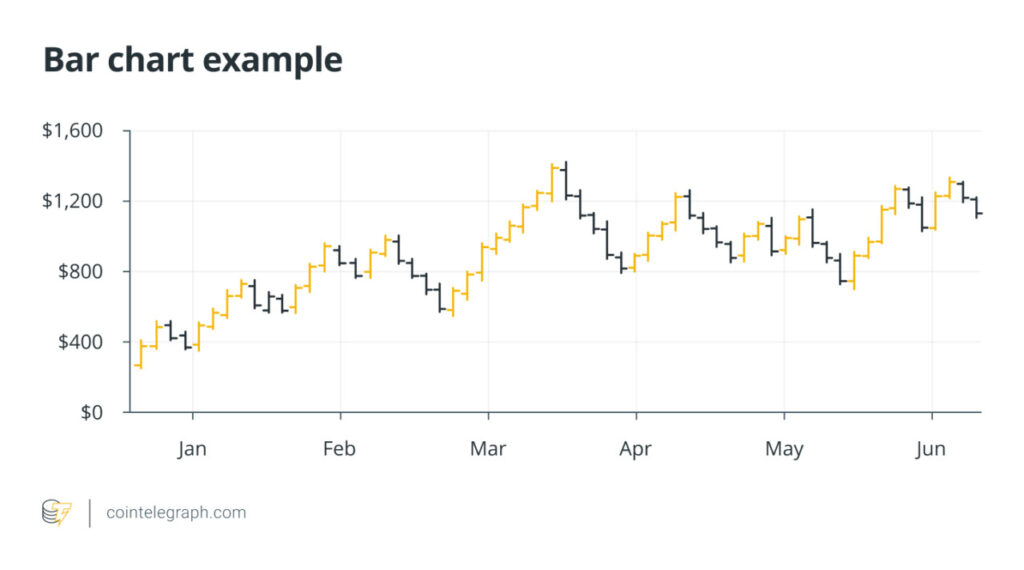
Bar charts provide more detailed information. Each bar represents one time period and displays the opening, closing, highest, and lowest prices. The top of the bar shows the highest price, while the bottom shows the lowest price. These charts are useful for analyzing the strength of a trend as well as the level of market volatility.
3. Candlestick Chart
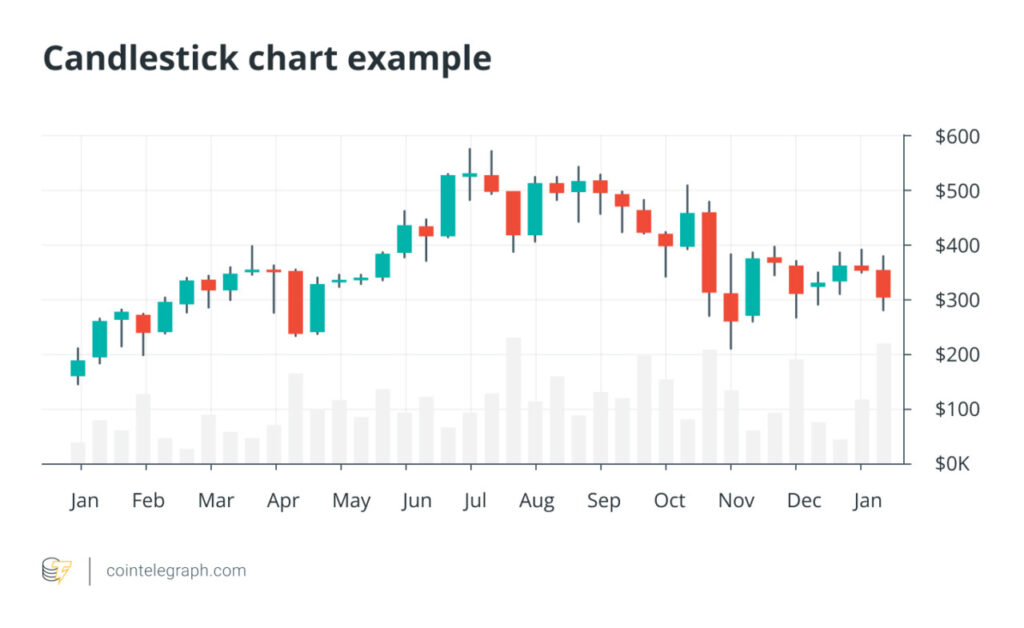
Candlestick charts are the most widely used chart type in the crypto market. Each candle shows the opening, closing, highest, and lowest prices within a certain period. Green color indicates a rising price, while red indicates a falling price.
Candlesticks help identify important patterns that may indicate the direction of the next price trend. Because they’re easy to read, they’ve become a key tool in technical analysis for many digital assets.
Read also: 3 Altcoins with Good Potential in October According to Analysts
Important Components in Crypto Graphics
1. Timeframe
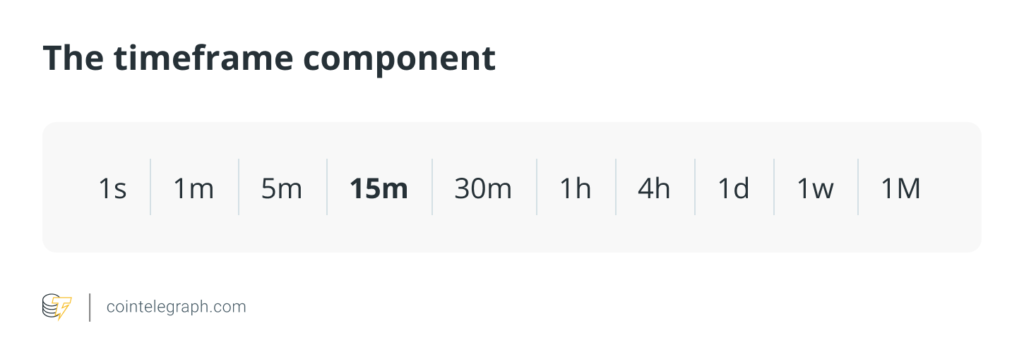
Timeframe indicates the time period used in the chart. Common examples include 1 minute, 15 minutes, 1 hour, 1 day, and 1 week. Short-term traders usually opt for short timeframes, while long-term investors focus more on daily or weekly charts to see the direction of broader trends.
2. Price and Volume Axis
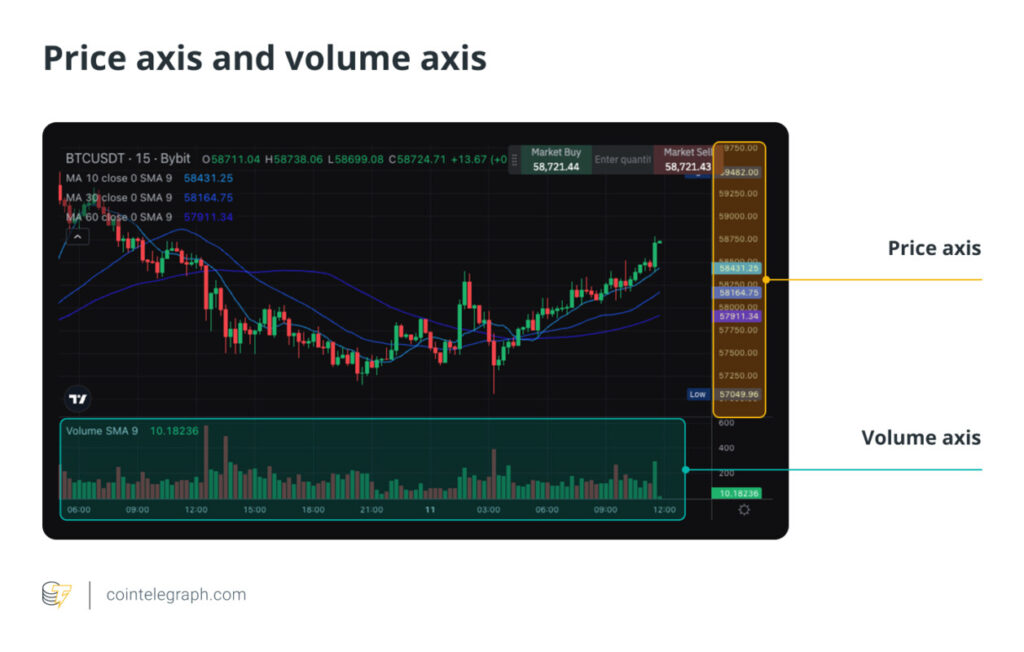
The vertical axis on the right side usually shows the price of the asset, while the bottom of the chart displays the volume of transactions. Volume depicts the total amount of an asset traded in a given period. High volume indicates strong market activity, while low volume signals weaker trading interest.
Read also: Altseason in 2025 is predicted to be more exciting than 2021, here’s why!
Indicators and Overlays on Crypto Charts
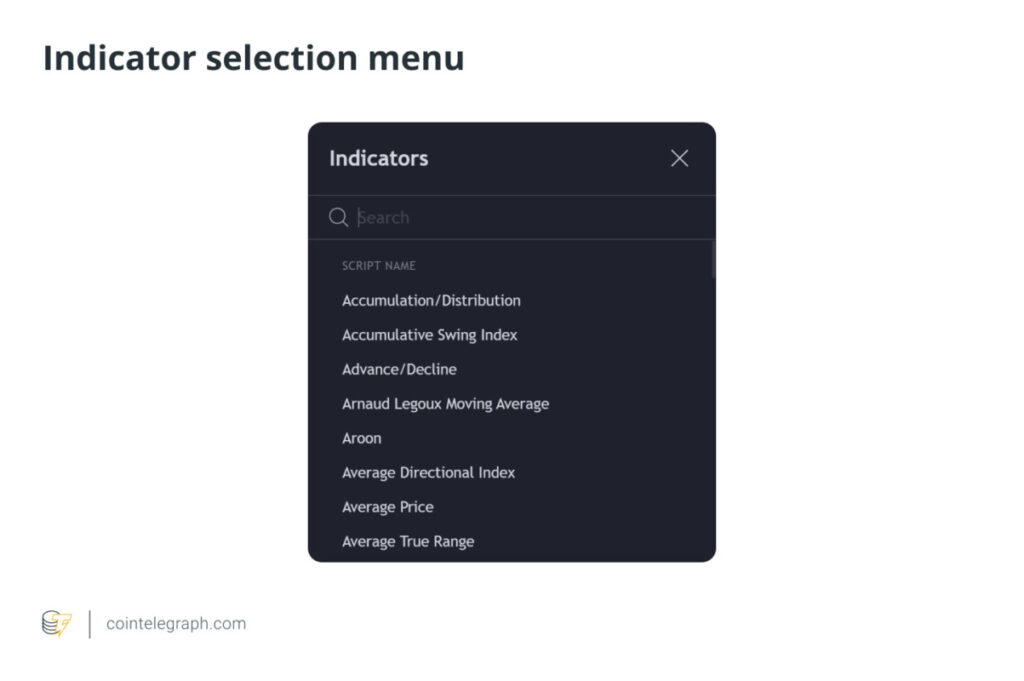
Indicators and overlays are used to deepen market analysis.
- Overlays are applied directly on the price chart, such as Moving Averages or Bollinger Bands.
- Indicators are usually below the chart, such as RSI (Relative Strength Index) or MACD (Moving Average Convergence Divergence).
1. Moving Average (MA)
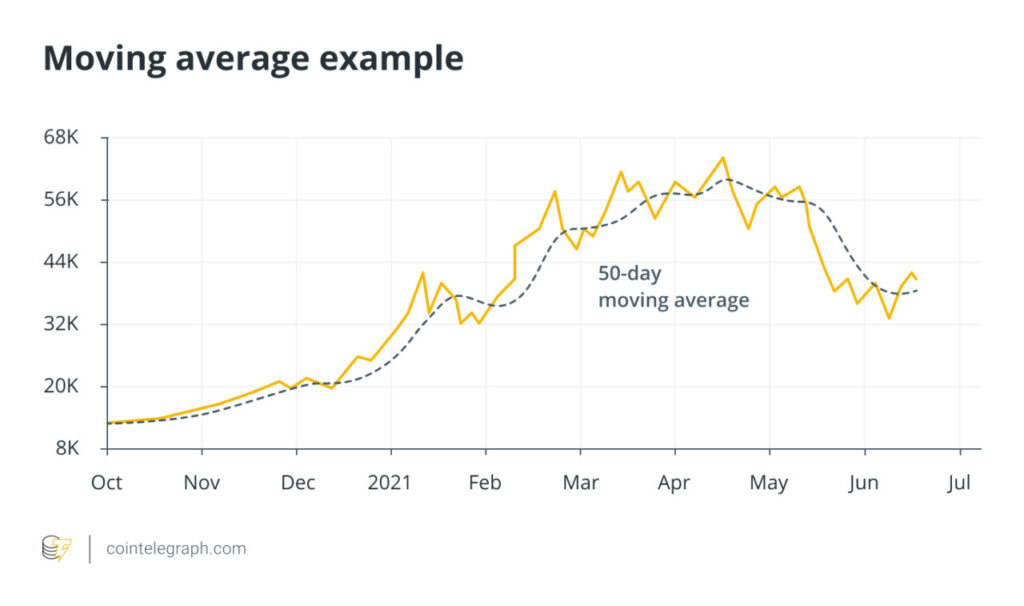
Moving averages help spot the direction of the price trend by averaging the movement of the data. If the MA line moves up, the trend is likely to strengthen; conversely, if it moves down, the trend is weakening.
2. Bollinger Bands
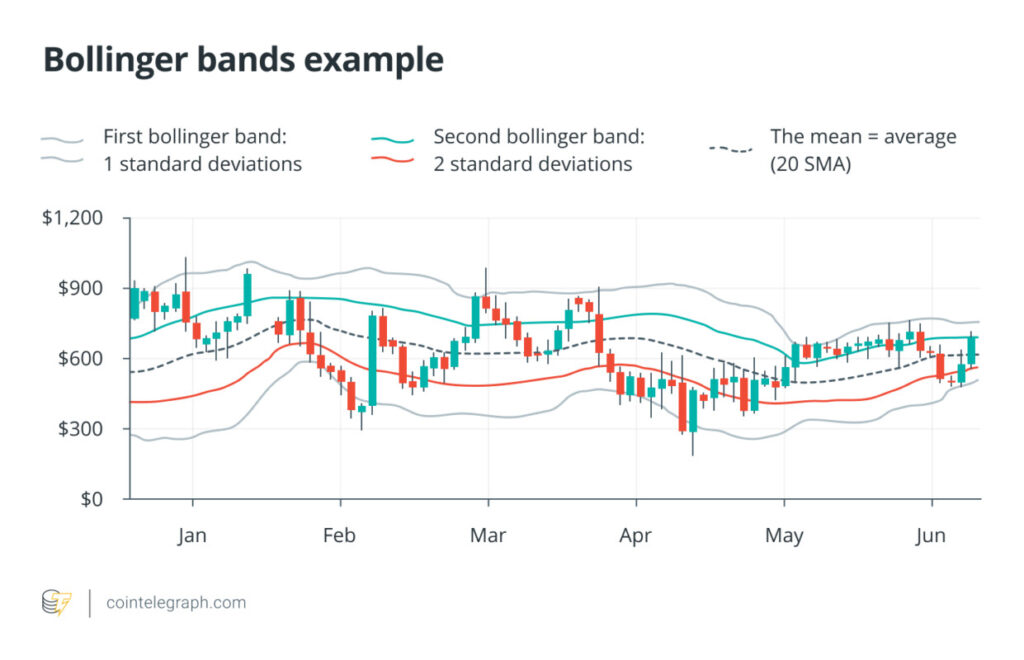
Bollinger Bands consist of three lines: the center line (price average) and two outer lines that indicate the level of volatility. When the price is near the upper line, the market could be in an overbought condition; if it is near the lower line, the market may be oversold.
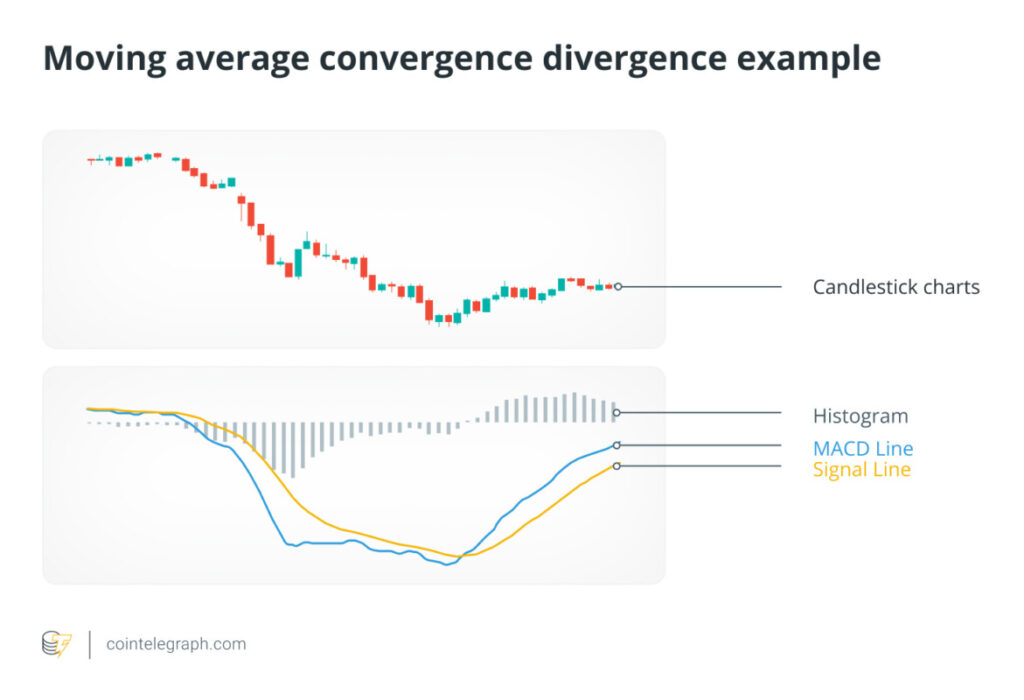
3. RSI and MACD
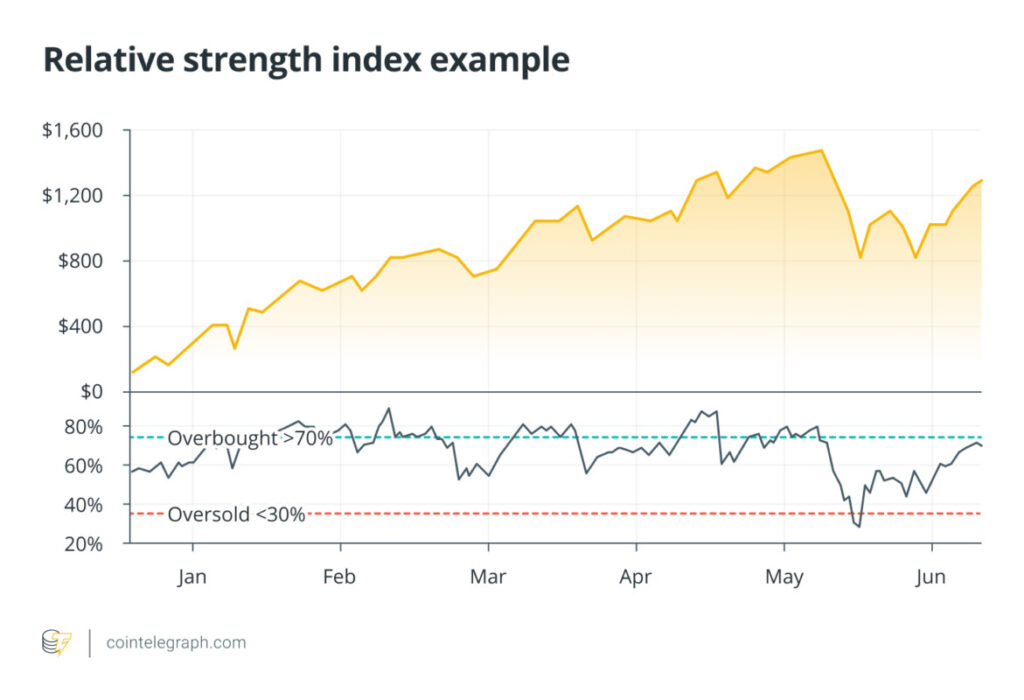
RSI is used to assess the strength of price momentum and identify overbought (above 70) or oversold (below 30) conditions. Meanwhile, MACD is used to spot potential changes in trend direction based on the relationship between the two moving averages.
Commonly Found Patterns in Crypto Charts
In technical analysis, chart patterns help predict the direction of price movements. Some popular patterns include:
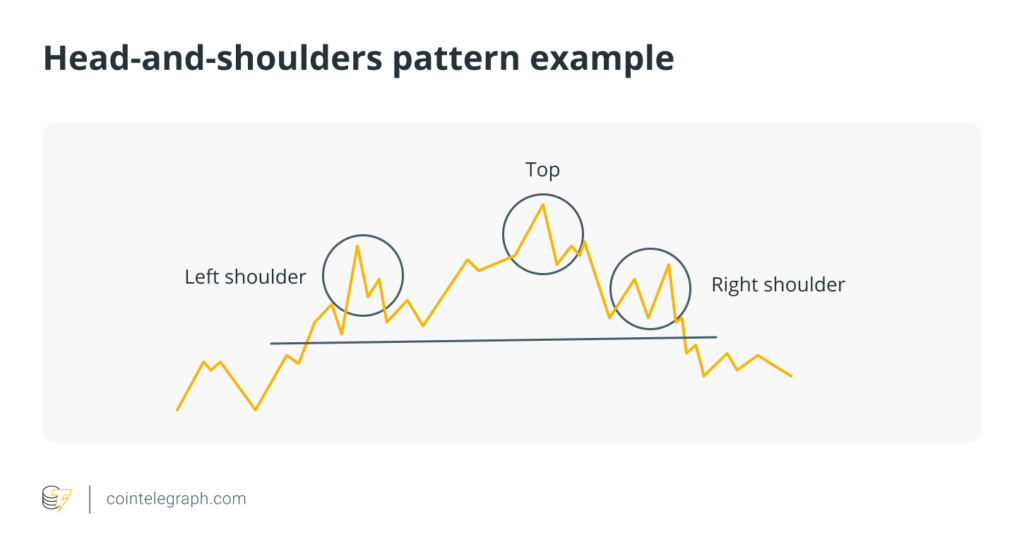
- Head and Shoulders: signals a possible change in trend from up to down.
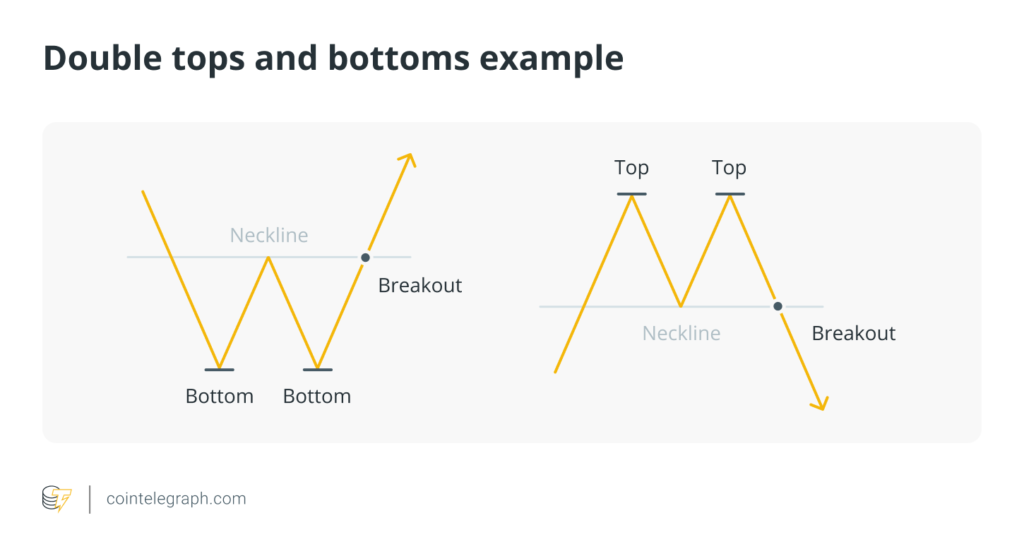
- Double Top and Double Bottom: indicates a price reversal after a strong trend.
- Triangle Pattern (Ascending, Descending, Symmetrical): indicates a potential continuation of the previous trend.
Recognizing these patterns requires practice and precision. Traders usually combine them with additional indicators such as volume and moving averages to ensure the validity of the signals.
Conclusion
The ability to read crypto charts is the first step in understanding the dynamics of the digital asset market. By recognizing price movement patterns, timeframes, and key indicators, traders can make more informed decisions.
Chart analysis does not provide certainty of outcome, but it does help identify possible market directions. With practice and discipline, understanding charts can be an important tool in any long-term crypto trading or investment strategy.
That’s the latest information about crypto. Follow us on Google News to get the latest crypto news about crypto projects and blockchain technology. Also, learn crypto from scratch with complete discussion through Pintu Academy and stay up-to-date with the latest crypto market such as bitcoin price today, xrp coin price today, dogecoin and other crypto asset prices through Pintu Market.
Enjoy an easy and secure crypto trading experience by downloading Pintu crypto app via Google Play Store or App Store now. Also, get a web trading experience with various advanced trading tools such as pro charting, various types of order types, and portfolio tracker only at Pintu Pro.
*Disclaimer
This content aims to enrich readers’ information. Pintu collects this information from various relevant sources and is not influenced by outside parties. Note that an asset’s past performance does not determine its projected future performance. Crypto trading activities have high risk and volatility, always do your own research and use cold cash before investing. All activities of buying and selling bitcoin and other crypto asset investments are the responsibility of the reader.
Reference:
- Cointelegraph. How to read crypto charts – A beginner’s guide. Accessed October 7, 2025
- Featured Image: Generated by AI


