Price of 1 Pi Network (PI) in Indonesia Today (10/15/25)
Jakarta, Pintu News – Pi Network (PI) prices today in Indonesia came under pressure again after showing volatile movements in recent days. Despite a slight rebound, PI’s price movement pattern is now forming a descending wedge structure, indicating the potential for the next big move – either towards recovery or further decline. On the other hand, the market is also displaying two conflicting signals, creating heightened price direction uncertainty among traders and the Pi community.
How much is 1 PI in Indonesia today?
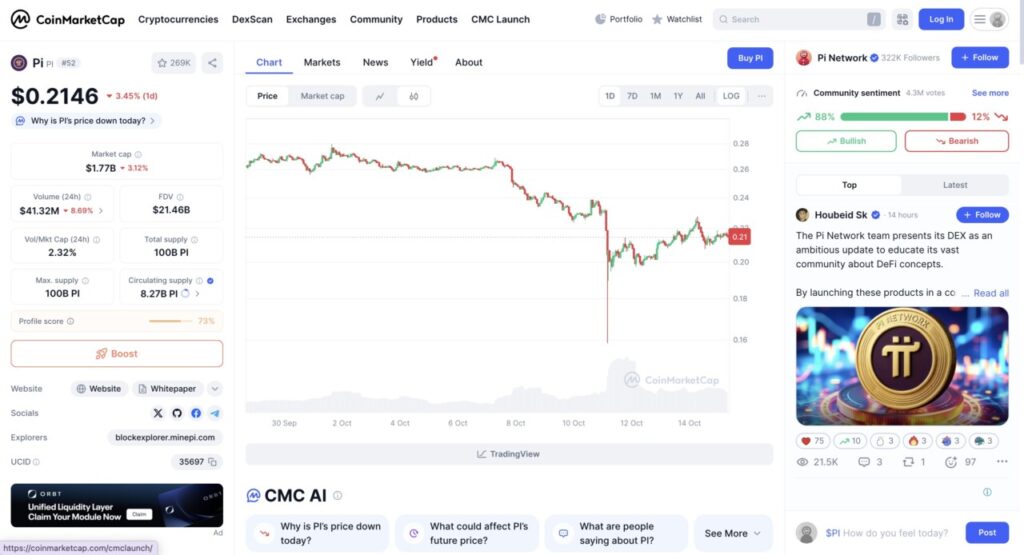
The Pi Network (PI) price chart above shows a significant downward trend in the last 24 hours, where the PI price corrected by around 3.45% and is currently at the level of $0.2146 (around Rp3,556). This decline was also followed by a decrease in market capitalization by 3.12% to $1.77 billion (Rp29.3 trillion) and daily trading volume which fell 8.69% to around $41.32 million (Rp685 billion).
The chart movement shows strong selling pressure since the beginning of October, with the downward trend getting sharper towards the middle of the month. There was an extreme drop to the bottom around $0.16, before the price slowly rebounded and stabilized around $0.21.
Although community sentiment on CoinMarketCap is still predominantly optimistic with 88% bullish and only 12% bearish, investors remain wary of short-term volatility. This pressure is likely triggered by profit-taking following the announcement regarding Pi Network’s DEX (Decentralized Exchange) development which is still in its early stages and is creating uncertainty in the market.
Also read: 3 Crypto Stocks that Have the Potential to Rebound This Week
Two Signals, One Uncertain Outcome
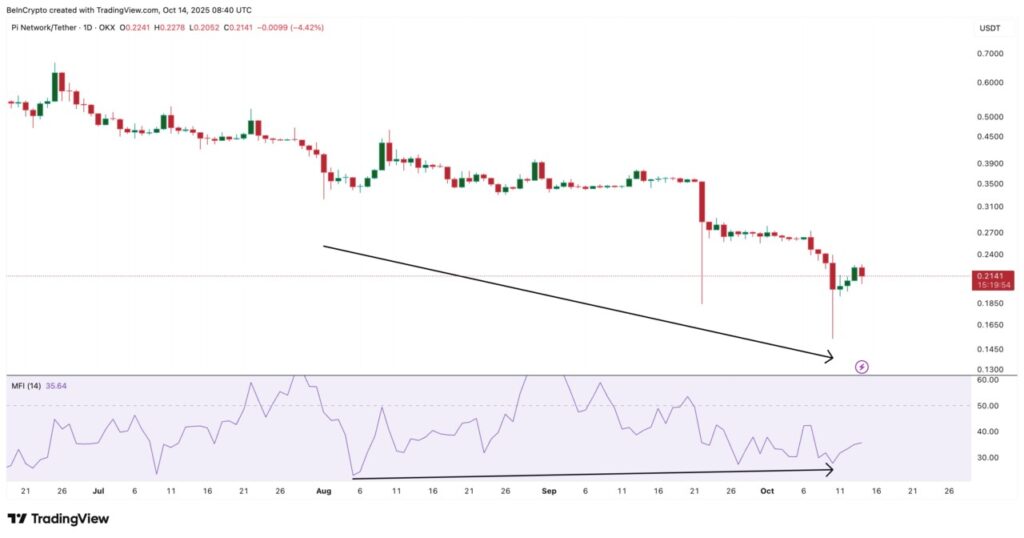
Pi Coin’s Money Flow Index (MFI), which tracks the flow of money in and out of the asset, has increased despite Pi Coin’s price registering a new low between August 1 and October 9. This is usually considered a bullish divergence, indicating that despite the price drop, new purchases are quietly coming into the market. This reflects increased retail interest-a type of slow accumulation that is often the basis for a rebound.
However, between October 6 and October 13, Pi Coin’s Relative Strength Index (RSI)-a measure of market momentum-showed a hidden bearish divergence. The price registered lower peaks while the RSI registered higher peaks, suggesting that buying momentum was fading despite short-term recovery efforts.
These two readings may not be completely contradictory, but they may indicate different stages of the same process: The MFI indicates initial accumulation, while the RSI warns that the recovery may face resistance before stronger confirmation.
Also read: After $20 Billion Crypto ‘Black Friday’, Traders Now Switch to Survival Mode!
Pi Coin Price Structure Reveals a Descending Wedge
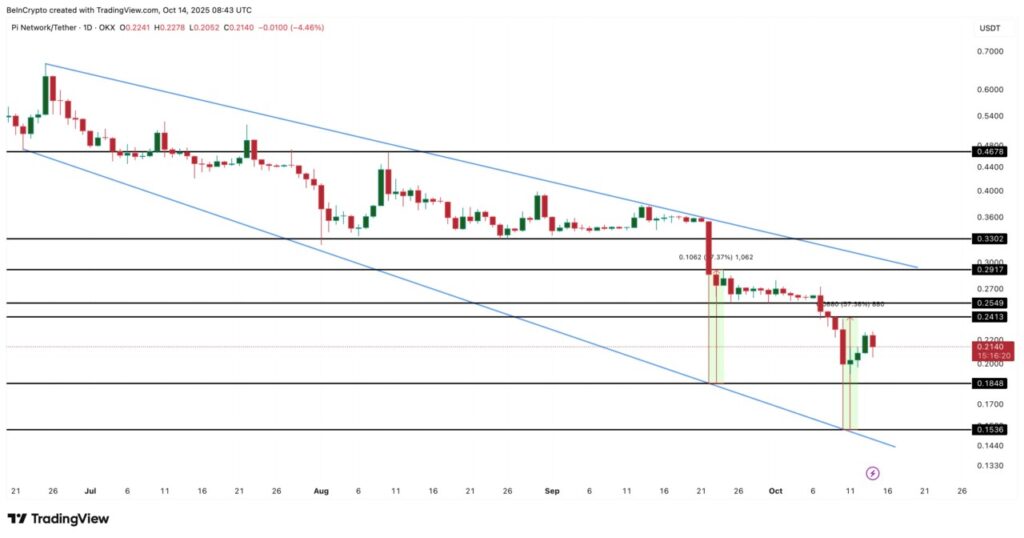
From a structural perspective, Pi Coin’s price is trading inside a descending wedge pattern-a pattern that often indicates a possible bullish reversal on daily charts. To confirm strength, Pi Coin’s daily price candle should move above $0.29, which would indicate a breakout from the wedge and possibly attract new buying volume.
However, looking at short-term history, a rebound similar to September 22, when PI surged 57% from $0.18 to $0.29, could be repeated. This implies a short-term target of around $0.24-$0.25, with an extended move towards $0.29 possible if momentum picks up.
And, breaking $0.29 on net would signal bullish strength for the Pi Coin price. Currently, Pi Coin (PI) is trading near $0.21, with strong support around $0.18 and $0.15. A clean daily close below $0.15 would break the wedge to the downside, invalidating the bullish setup.
That’s the latest information about crypto. Follow us on Google News to get the latest crypto news about crypto projects and blockchain technology. Also, learn crypto from scratch with complete discussion through Pintu Academy and stay up-to-date with the latest crypto market such as bitcoin price today, xrp coin price today, dogecoin and other crypto asset prices through Pintu Market.
Enjoy an easy and secure crypto trading experience by downloading Pintu crypto app via Google Play Store or App Store now. Also, get a web trading experience with various advanced trading tools such as pro charting, various types of order types, and portfolio tracker only at Pintu Pro.
*Disclaimer
This content aims to enrich readers’ information. Pintu collects this information from various relevant sources and is not influenced by outside parties. Note that an asset’s past performance does not determine its projected future performance. Crypto trading activities have high risk and volatility, always do your own research and use cold cash before investing. All activities of buying and selling bitcoin and other crypto asset investments are the responsibility of the reader.
Reference:
- BeInCrypto. Pi Coin Price: Bullish Setup, Bearish Signal. Accessed on October 15, 2025
- Featured Image: Coinpedia