Solana Stages a Comeback as Technical Pattern Points to $550 Target
Jakarta, Pintu News – Solana continues to show surprising resilience, while most large-cap coins struggle to stabilize after recent price drops.
As of October 15, Solana’s price had only fallen about 1.8%, much less than BNB , which fell 4.8%, and XRP and Dogecoin , which fell more than 2% each.
SOL tokens have even recovered more than 20% from their post-drop low, indicating that the “Black Friday” panic is starting to subside.
With increasing confidence from holders and traders, Solana now looks poised for a bigger move – possibly even beyond its current price level.
Short-Term Investors Go for Accumulation
On-chain data shows that both long-term and short-term investors are actively positioning themselves, signaling confidence in Solana’s recovery and its long-term strength.
Read also: Pi Network Price Drops Again Today — But Are Pi Coin Holders Still Optimistic?
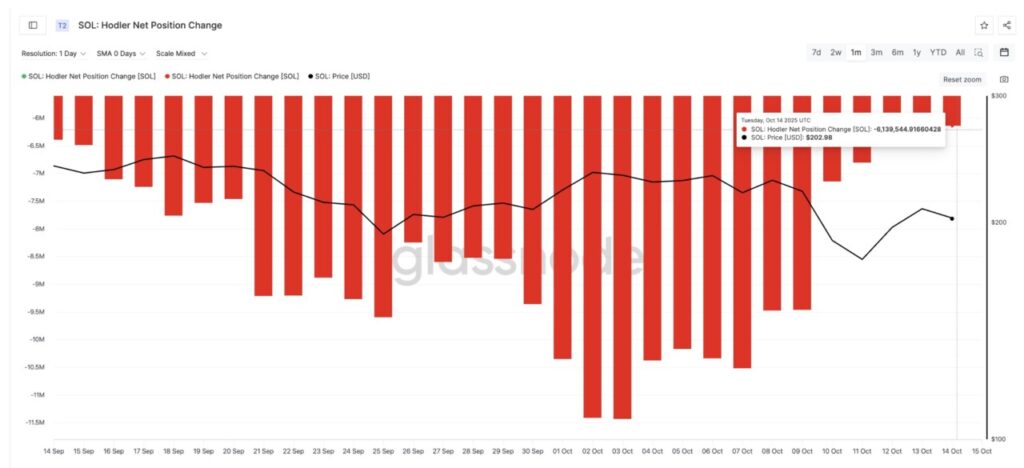
Holder Net Position Change – an indicator that measures how much long-term holders are buying or selling – is still in negative territory, but is showing significant improvement. Between October 3 to 14, long-term holders reduced their net sell from around 11.4 million SOLs to 6.1 million SOLs, a drop of around 46%.
Even during the price crash on October 10 (known as “Black Friday”), where fear from short-term investors rose sharply, this indicator continued to improve. This indicates that selling pressure was easing despite the price drop. This change is likely to be the factor that helped Solana bounce back more than 20% from its low and break back into the $200 zone.
Although the indicator has yet to show net buying, the data indicates that long-term investors are starting to ease selling pressure and prepare for a stronger move ahead.
Long-term Holders Also Accumulate
On the other hand, short-term holders showed a clear pattern of accumulation, based on data from the HODL Waves indicator. The group that held the asset for 1 week to 1 month increased its holdings from 11.1% on September 14 to 12.65% on October 14, although it did sell a little during the downturn.
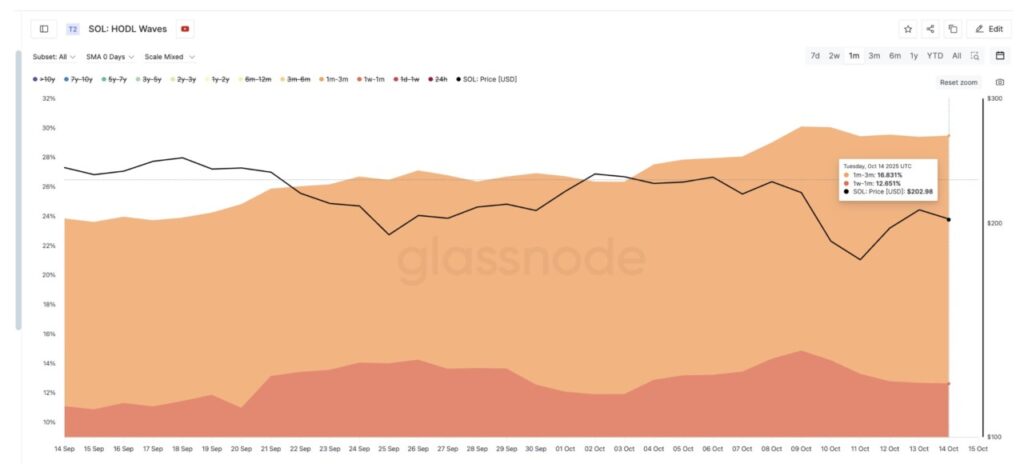
The 1-month to 3-month group even rose from 12.74% to 16.83%, which is one of the biggest jumps compared to other major coins.
HODL Waves itself is an indicator that tracks the percentage of coin supply based on the length of time coins are held in wallets – useful for identifying accumulation or distribution trends.
Overall, this shift shows the confidence and discipline of the market: long-term investors are starting to cut back on selling, while short-term traders are slowly buying the dip.
Read also: Bitcoin Drops to $110,000 Today — Could It Fall to $50,000? Peter Brandt Thinks So
This Channel Pattern Could Pave the Way to $550+ Price for Solana
In terms of technical analysis, Solana has been moving in a wide ascending channel pattern since June 22. Every major move so far has followed this channel structure, with the move between June and September resulting in a 100% gain.
Currently, key resistances are at $227 and $250, while a confirmed breakout above $287 would signal an exit from the channel pattern. Based on Fibonacci extension projections, the next potential targets are $346, $453, $540, and could even reach $599 if the strengthening momentum continues.
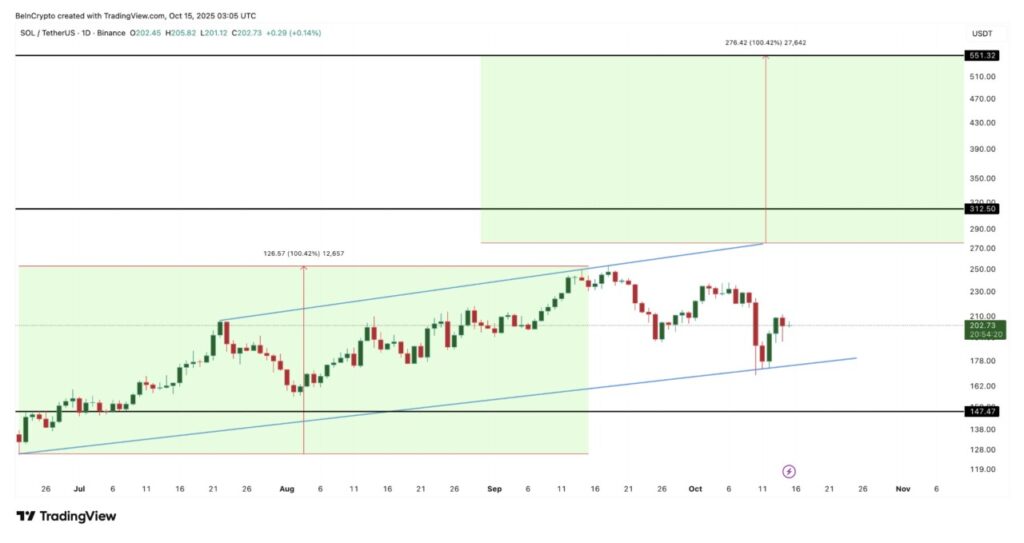
The target is within the projected upside zone of more than 100%, according to the ascending channel pattern calculation, which specifically leads to a price of $551 for Solana.
Meanwhile, strong support is at the $190 area, where buyers have consistently stepped in and arrested the decline. As long as Solana holds above this level, the overall price movement structure is still considered bullish.
However, if there is a daily candle close below $190, then Solana’s price risks declining to even lower levels.
That’s the latest information about crypto. Follow us on Google News to get the latest crypto news about crypto projects and blockchain technology. Also, learn crypto from scratch with complete discussion through Pintu Academy and stay up-to-date with the latest crypto market such as bitcoin price today, xrp coin price today, dogecoin and other crypto asset prices through Pintu Market.
Enjoy an easy and secure crypto trading experience by downloading Pintu crypto app via Google Play Store or App Store now. Also, get a web trading experience with various advanced trading tools such as pro charting, various types of order types, and portfolio tracker only at Pintu Pro.
*Disclaimer
This content aims to enrich readers’ information. Pintu collects this information from various relevant sources and is not influenced by outside parties. Note that an asset’s past performance does not determine its projected future performance. Crypto trading activities have high risk and volatility, always do your own research and use cold cash before investing. All activities of buying and selling bitcoin and other crypto asset investments are the responsibility of the reader.
Reference:
- BeInCrypto. Solana Price: Holders Eye $550-Plus Breakout. Accessed on October 16, 2025