These 2 Metrics Show Why Pi Network (PI) Price Recovery Isn’t Over Yet!
Jakarta, Pintu News – Pi Coin’s price recovery in recent days has surprised many market participants. In the past week, the gain reached 17.3%, cutting the monthly loss to just 5.4%. Even in the last 24 hours, an increase of about 0.6% was recorded.
Pi Network Graph Analysis
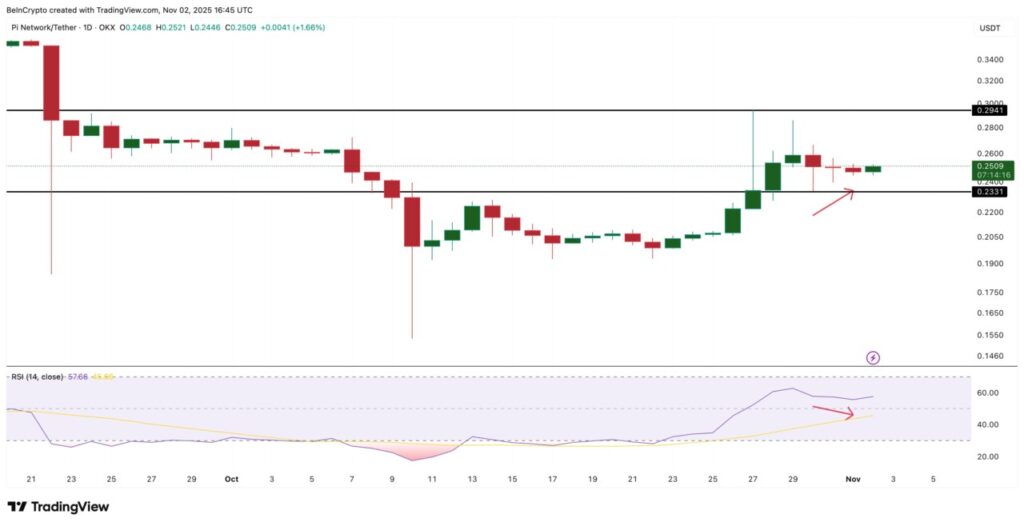
The daily chart shows the first signs of strength. Between October 30 and November 1, the Pi Coin (PI) price registered a higher low while the Relative Strength Index (RSI) registered a lower low.
This discrepancy, known as a hidden bullish divergence, often signals that the control of the market is starting to switch from sellers to buyers, and the short-term (weekly) uptrend will probably continue. This daily RSI pattern is in line with what’s happening on the 4-hour chart.
The 50-period Exponential Moving Average (EMA), which follows the average price with emphasis on the most recent candle, is approaching a crossover above the 200-period EMA. This crossover, known as a “golden crossover,” usually indicates increasing bullish momentum. If this crossover occurs, it could strengthen the case for Pi Coin’s price recovery in the short term.
Read also: Where Will Stellar (XLM) Go in November 2025?
Retail Funds Continue to Flow
One of the reasons Pi Coin’s price hasn’t lost momentum is the continued activity from retail traders. The Money Flow Index (MFI), which tracks both price and trading volume to gauge buying and selling pressure, has been forming higher highs since October 24. Although the MFI dipped slightly after October 29, it has bounced back, indicating renewed inflows.
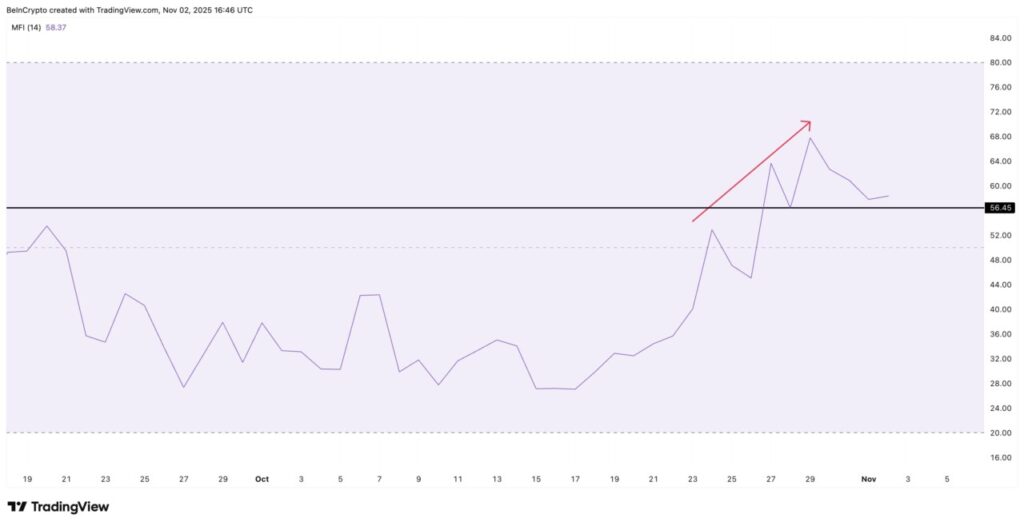
Currently, the MFI is hovering around 58, above the neutral line of 50. As long as the MFI stays above 56.45 and doesn’t register a lower low, it shows that traders are still buying on dips, helping Pi Coin’s price to sustain its bounce.
Also read: Bitcoin (BTC) Fails to Respond to US-China Deal, What’s Next?
Key Levels to Watch for Pi Coin Price
On the Pi Network price chart, the first major resistance is at $0.255. A clean daily close above that level could push Pi towards $0.270, which would mean a move of 8.4% from current levels. If this range is exceeded, the next target would be $0.293, followed by $0.340 and $0.376 as higher upside levels.
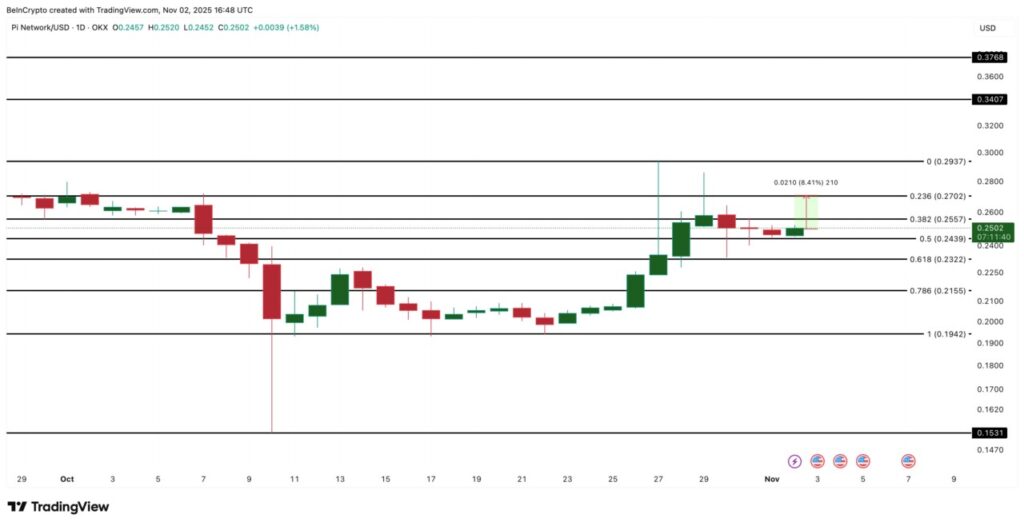
On the other hand, $0.21 serves as the first major support level. Below that, $0.194 remains a strong floor for now. However, if $0.194 does not hold, it will derail the current bullish setup and open up chances of a deeper correction towards $0.153.
Conclusion
Momentum indicators and retail activity suggest that Pi Coin’s price bounce still has potential. However, to maintain this momentum, it is imperative for the price to hold above $0.243 and break $0.255 in the coming days.
That’s the latest information about crypto. Follow us on Google News to get the latest crypto news about crypto projects and blockchain technology. Also, learn crypto from scratch with complete discussion through Pintu Academy and stay up-to-date with the latest crypto market such as bitcoin price today, xrp coin price today, dogecoin and other crypto asset prices through Pintu Market.
Enjoy an easy and secure crypto trading experience by downloading Pintu crypto app via Google Play Store or App Store now. Also, get a web trading experience with various advanced trading tools such as pro charting, various types of order types, and portfolio tracker only at Pintu Pro.
*Disclaimer
This content aims to enrich readers’ information. Pintu collects this information from various relevant sources and is not influenced by outside parties. Note that an asset’s past performance does not determine its projected future performance. Trading crypto carries high risk and volatility, always do your own research and use cold hard cash before investing. All activities of buying and selling bitcoin and other crypto asset investments are the responsibility of the reader.
Reference
- BeInCrypto. Pi Coin Price Bounce: Bullish Signs – November 2025. Accessed on November 4, 2025
- Featured image: Coinpedia


