XRP Price Prediction: Seller Dominance Increases, Can XRP Break $2.30?
Jakarta, Pintu News – The price of XRP is trading at around $2.25 after successfully defending the $2.20 support level for three consecutive sessions. The market remains under pressure as selling pressure remains strong along the downtrend line, while spot trading flows have not shown any positive movement.
Momentum remains weak, and there is no strong indication yet from buyers to enter at higher price levels.
Spot Outflows Continue amid Defensive Market Stance
Data from Coinglass recorded spot outflows of $9.4 million in the latest session, extending the trend of recent weeks dominated by negative flows. The market is showing a tendency to pull liquidity out of the exchanges instead of absorbing the existing supply.
Read also: Aster Price Analysis: Poised to Break $1.38 — Is a Bullish Surge Imminent?
Over the past two months, XRP has failed to form a consistent green inflow trend. Even when prices recovered, outflows remained high, signaling that market participants are yet to position for an upward reversal.
Descending Trendline Presses the Price Below the EMA
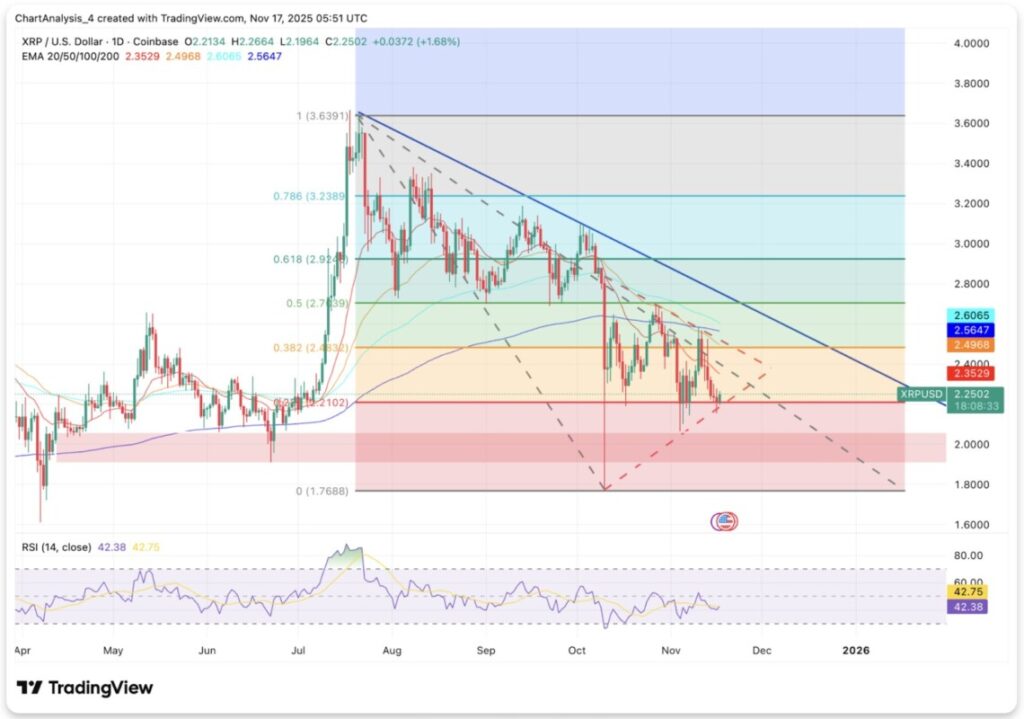
The daily chart (11/17) shows that the price of XRP is still restrained by the downtrend line that has been the upper limit since July. The price is currently below the 20, 50, 100, and 200 EMAs, which are concentrated in the $2.35-$2.56 range. This stacked array of EMAs forms a strong resistance that reinforces the bearish bias.
Every time the price touched this resistance zone, the rally failed. Sellers managed to defend the 0.382 Fibonacci level at $2.83, then 0.5 at $2.77, and now the 20 EMA near $2.35. This pattern shows that the market is losing steam every time it tries to rally.
The $2.20 area remains the key support on the daily time frame. If this level is broken, the potential for a deeper correction opens up towards the $2.05 to $1.95 zone, which is in line with the lower limit of the long-term Fibonacci retracement.
The RSI was at 42, reflecting neutral to weak momentum. The absence of a higher low confirms that buyers are yet to show dominance.
Intraday Structure Shows Downward Channel
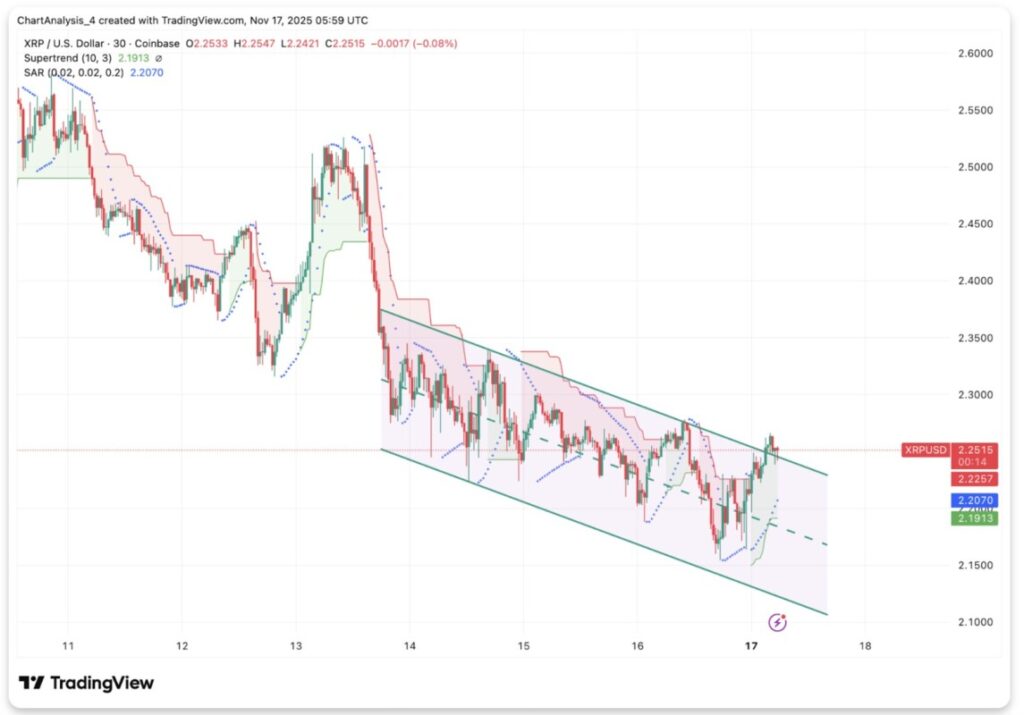
On the 30-minute chart, XRP is moving within a clear descending channel. The price has tested the upper limit of the channel twice but failed to break through. The Supertrend indicator remains red, and the Parabolic SAR continues to dot above the price, indicating intraday selling pressure is still dominant.
Short-term support is around $2.19, an area that has managed to hold the bears several times. If the price breaks it, the selling momentum could increase and open up space towards the canal floor at $2.12.
Intraday recovery attempts have been shallow so far. A rise above $2.30 is required to show early signs of strength. Without that, any bounce is only corrective in nature.
Open Interest rises, but market sentiment remains cautious
Derivatives data showed open interest rose 1% to $3.68 billion. Trading volume jumped 48%, reflecting active repositioning, but not yet reflecting market confidence.
Read also: 3 Most-Awaited Crypto Unlock Tokens in the Third Week of November 2025
The long-short ratio stands at around 0.96, indicating a relatively balanced position. However, the ratio of top traders on Binance is skewed towards long positions, indicating that experienced traders may start taking early positions for a potential reversal.
Despite the increase in open interest, the liquidation data did not show any major pressure on either side. This indicates that the market is preparing for a big move, but has yet to show a clear directional commitment.
Key Levels to Pay Attention to
Resistance:
- $2,30: Initial level to be broken to open up a chance of gains
- $2,35: 20 EMA and recurring price rejection area
- $2.56: Cluster of 50 and 100 EMAs, a strong technical barrier
- $2,92: 0.618 Fibonacci level and key limit for breakout confirmation
Support:
- $2.20: Very crucial short-term base
- $2,05: Midpoint of the channel and in line with Fibonacci retracement
- $1,95: Key demand zones and lower liquidity regions
Outlook: Will XRP Go Up?
XRP is still locked below the downtrend line with no indication of a reversal. Bullish momentum will only be seen if the price is able to break and hold above $2.35 with support from improving spot flows. A break above $2.56 could open a path towards $2.77 and then $2.92.
Conversely, the bearish scenario will activate if the price falls below $2.20. A daily close below this level could potentially push the price to $2.05, even $1.95 as the next liquidity zone. The control remains with the sellers until the buyers are able to break the resistance, not just maintain the support.
FAQ
What is Ripple (XRP)?
Ripple (XRP) is a digital currency used in the Ripple payment network to facilitate the transfer of funds between various currencies.
Why is the XRP price under pressure?
The price of XRP is under pressure due to the continuous dominance of sellers and lack of significant inflows in the spot market.
What does EMA mean in the context of XRP price?
EMA (Exponential Moving Average) is a type of moving average that gives more weight to the most recent price data and is used to identify price trends.
That’s the latest information about crypto. Follow us on Google News to get the latest crypto news about crypto projects and blockchain technology. Also, learn crypto from scratch with complete discussion through Pintu Academy and stay up-to-date with the latest crypto market such as bitcoin price today, xrp coin price today, dogecoin and other crypto asset prices through Pintu Market.
Enjoy an easy and secure crypto trading experience by downloading Pintu crypto app through Google Play Store or App Store now. Also, get a web trading experience with various advanced trading tools such as pro charting, various types of order types, and portfolio tracker only at Pintu Pro.
*Disclaimer
This content aims to enrich readers’ information. Pintu collects this information from various relevant sources and is not influenced by outside parties. Note that an asset’s past performance does not determine its projected future performance. Crypto trading activities have high risk and volatility, always do your own research and use cold cash before investing. All activities of buying and selling bitcoin and other crypto asset investments are the responsibility of the reader.
Reference:
- CoinEdition. XRP Price Prediction: Bears Tighten Grip as XRP Struggles to Break $2.30. Accessed on November 18, 2025